29
/
en
AIzaSyAYiBZKx7MnpbEhh9jyipgxe19OcubqV5w
April 1, 2024
69970
Argentina
ARG
true
2
1
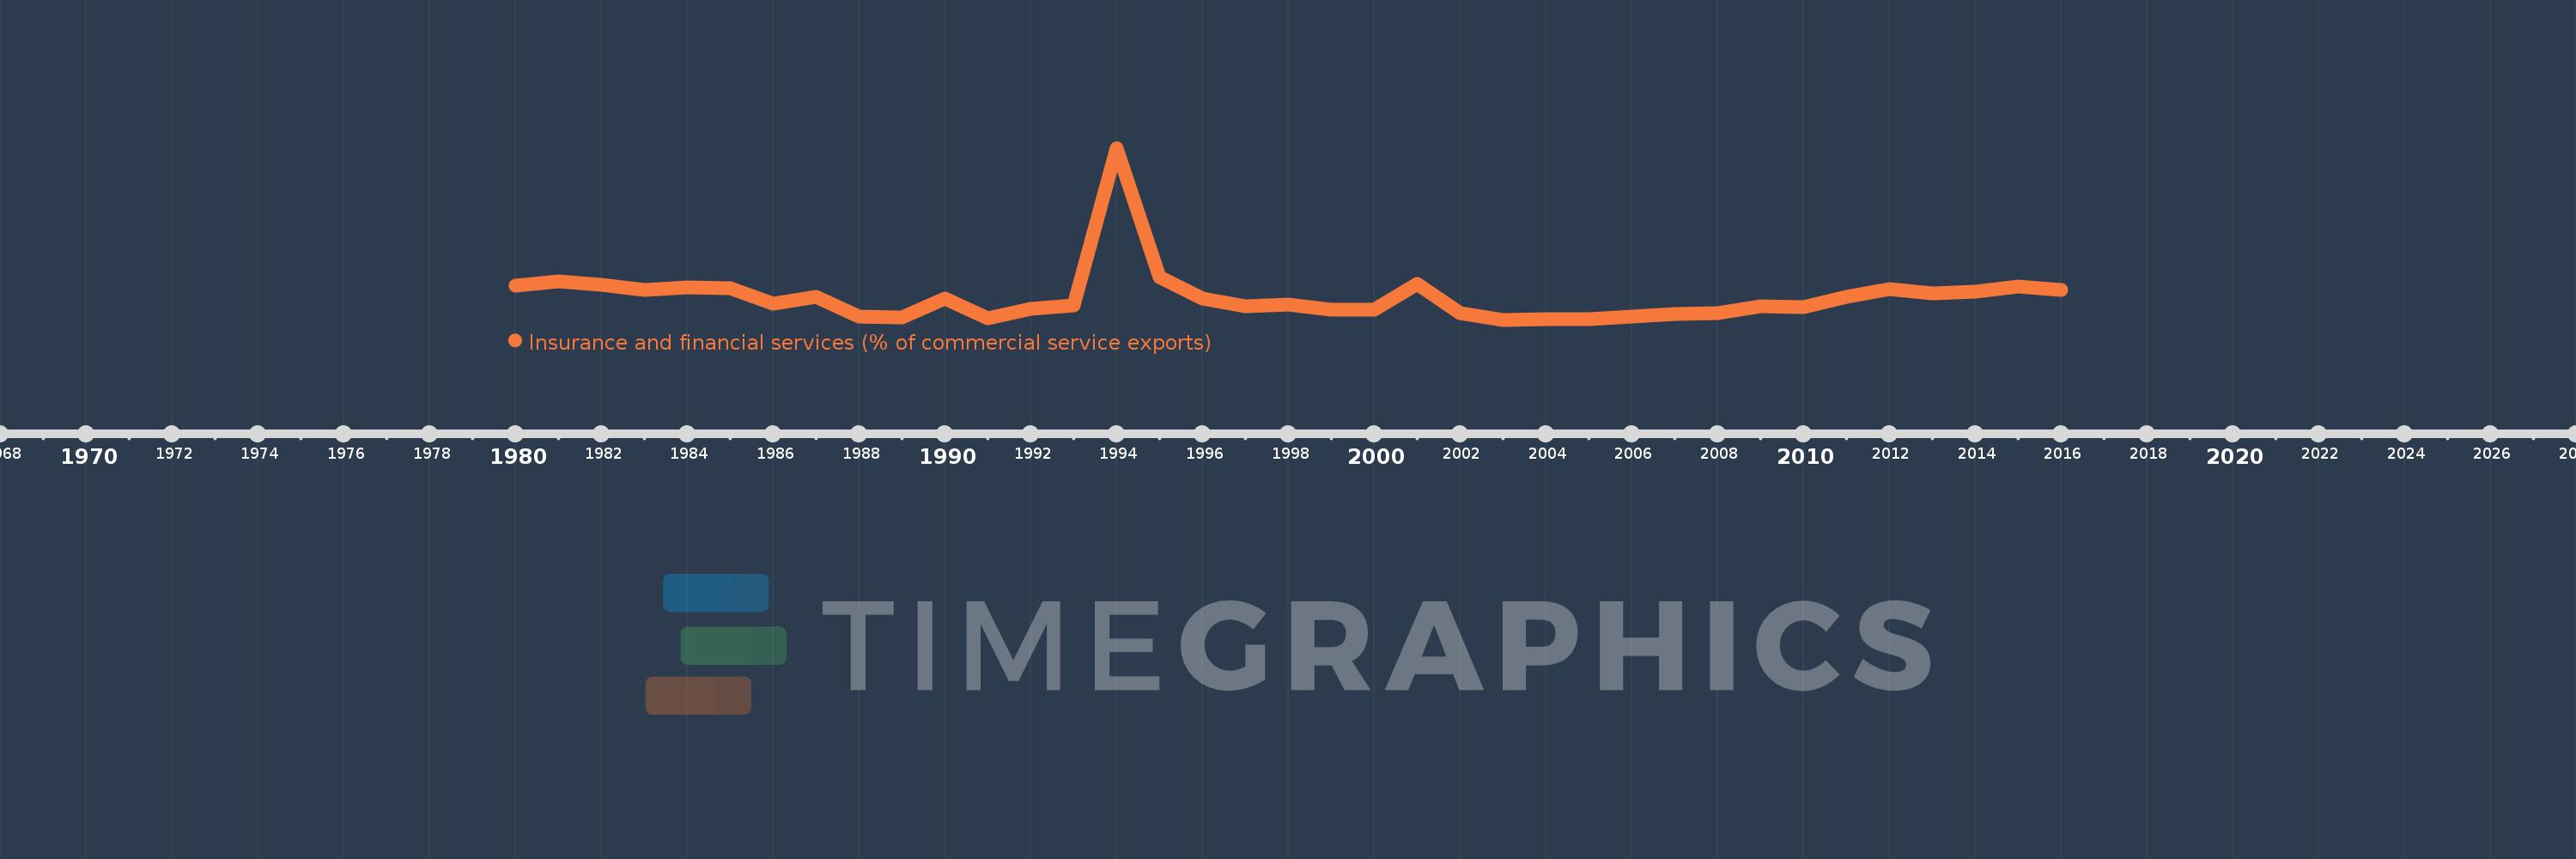
Insurance and financial services (% of commercial service exports)
2016,2015,2014,2013,2012,2011,2010,2009,2008,2007,2006,2005,2004,2003,2002,2001,2000,1999,1998,1997,1996,1995,1994,1993,1992,1991,1990,1989,1988,1987,1986,1985,1984,1983,1982,1981,1980
This statistics in other country:
AfghanistanAlbaniaAlgeriaAngolaAntigua and BarbudaArab WorldArgentinaArmeniaArubaAustraliaAustriaAzerbaijanBahrainBangladeshBarbadosBelarusBelgiumBelizeBeninBermudaBhutanBoliviaBosnia and HerzegovinaBotswanaBrazilBrunei DarussalamBulgariaBurkina FasoBurundiCabo VerdeCambodiaCameroonCanadaCaribbean small statesCentral African RepublicCentral Europe and the BalticsChadChileChinaColombiaComorosCongo, Dem. Rep.Congo, Rep.Costa RicaCote d'IvoireCroatiaCuracaoCyprusCzech RepublicDenmarkDominicaDominican RepublicEarly-demographic dividendEast Asia & PacificEast Asia & Pacific (excluding high income)East Asia & Pacific (IDA & IBRD countries)EcuadorEgypt, Arab Rep.El SalvadorEritreaEstoniaEthiopiaEuro areaEurope & Central AsiaEurope & Central Asia (excluding high income)Europe & Central Asia (IDA & IBRD countries)European UnionFaroe IslandsFijiFinlandFragile and conflict affected situationsFranceFrench PolynesiaGabonGambia, TheGeorgiaGermanyGhanaGreeceGrenadaGuatemalaGuineaGuinea-BissauGuyanaHaitiHeavily indebted poor countries (HIPC)High incomeHondurasHong Kong SAR, ChinaHungaryIBRD onlyIcelandIDA & IBRD totalIDA onlyIDA totalIndiaIndonesiaIran, Islamic Rep.IraqIrelandIsraelItalyJamaicaJapanJordanKazakhstanKenyaKiribatiKorea, Rep.KosovoKuwaitKyrgyz RepublicLao PDRLate-demographic dividendLatin America & Caribbean Latin America & Caribbean (excluding high income)Latin America & the Caribbean (IDA & IBRD countries)LatviaLeast developed countries: UN classificationLebanonLesothoLiberiaLibyaLithuaniaLow & middle incomeLow incomeLower middle incomeLuxembourgMacao SAR, ChinaMacedonia, FYRMadagascarMalawiMalaysiaMaldivesMaliMaltaMauritaniaMauritiusMexicoMiddle East & North AfricaMiddle East & North Africa (excluding high income)Middle East & North Africa (IDA & IBRD countries)Middle incomeMoldovaMongoliaMontenegroMoroccoMozambiqueMyanmarNamibiaNepalNetherlandsNew CaledoniaNew ZealandNicaraguaNigerNigeriaNorth AmericaNorwayOECD membersOmanOther small statesPacific island small statesPakistanPalauPanamaPapua New GuineaParaguayPeruPhilippinesPolandPortugalPost-demographic dividendPre-demographic dividendQatarRomaniaRussian FederationRwandaSamoaSao Tome and PrincipeSaudi ArabiaSenegalSerbiaSeychellesSierra LeoneSingaporeSint Maarten (Dutch part)Slovak RepublicSloveniaSmall statesSolomon IslandsSouth AfricaSouth AsiaSouth Asia (IDA & IBRD)South SudanSpainSri LankaSt. Kitts and NevisSt. LuciaSt. Vincent and the GrenadinesSub-Saharan Africa Sub-Saharan Africa (excluding high income)Sub-Saharan Africa (IDA & IBRD countries)SudanSurinameSwazilandSwedenSwitzerlandSyrian Arab RepublicTajikistanTanzaniaThailandTimor-LesteTogoTongaTrinidad and TobagoTunisiaTurkeyTuvaluUgandaUkraineUnited KingdomUnited StatesUpper middle incomeUruguayVanuatuVenezuela, RBWest Bank and GazaWorldZambiaZimbabwe Timeline:
This timeline shows a graph from 1980 to 2016 of Argentina. No data until 1979. Number of actual observations by date: 37.
Source name:
World Development Indicators
Source organization:
International Monetary Fund, Balance of Payments Statistics Yearbook and data files.
Categories, topics:
Private Sector, Trade
Last updated:
apr 23, 2017
Indicators value changes by year
At the date of observation
Value
Absolute change
Change from previous value
jan 1, 1980
0.372
+0.372
0.0%
jan 1, 1981
0.42
+0.049
13.1%
jan 1, 1982
0.381
-0.04
-9.45%
jan 1, 1983
0.33
-0.05
-13.2%
jan 1, 1984
0.356
+0.025
7.69%
jan 1, 1985
0.345
-0.011
-3.04%
jan 1, 1986
0.188
-0.157
-45.63%
jan 1, 1987
0.262
+0.074
39.44%
jan 1, 1988
0.058
-0.204
-77.92%
jan 1, 1989
0.053
-0.005
-8.61%
jan 1, 1990
0.24
+0.187
353.98%
jan 1, 1991
0.044
-0.196
-81.57%
jan 1, 1992
0.138
+0.094
212.42%
jan 1, 1993
0.169
+0.031
22.39%
jan 1, 1994
1.774
+1.606
950.64%
jan 1, 1995
0.459
-1.315
-74.13%
jan 1, 1996
0.246
-0.213
-46.5%
jan 1, 1997
0.163
-0.083
-33.73%
jan 1, 1998
0.183
+0.02
12.33%
jan 1, 1999
0.132
-0.051
-27.76%
jan 1, 2000
0.128
-0.005
-3.44%
jan 1, 2001
0.392
+0.265
207.74%
jan 1, 2002
0.095
-0.297
-75.67%
jan 1, 2003
0.027
-0.069
-71.88%
jan 1, 2004
0.031
+0.004
15.98%
jan 1, 2005
0.035
+0.004
11.25%
jan 1, 2006
0.059
+0.024
70.27%
jan 1, 2007
0.084
+0.025
41.82%
jan 1, 2008
0.09
+0.007
7.92%
jan 1, 2009
0.166
+0.076
84.49%
jan 1, 2010
0.157
-0.009
-5.43%
jan 1, 2011
0.257
+0.099
63.16%
jan 1, 2012
0.34
+0.083
32.33%
jan 1, 2013
0.298
-0.042
-12.42%
jan 1, 2014
0.312
+0.014
4.73%
jan 1, 2015
0.368
+0.056
18.02%
jan 1, 2016
0.334
-0.034
-9.11%
Ranking of countries by current statistics by years


Comments: