29
/
en
AIzaSyAYiBZKx7MnpbEhh9jyipgxe19OcubqV5w
April 1, 2024
33536
European Union
EUU
false
2
1
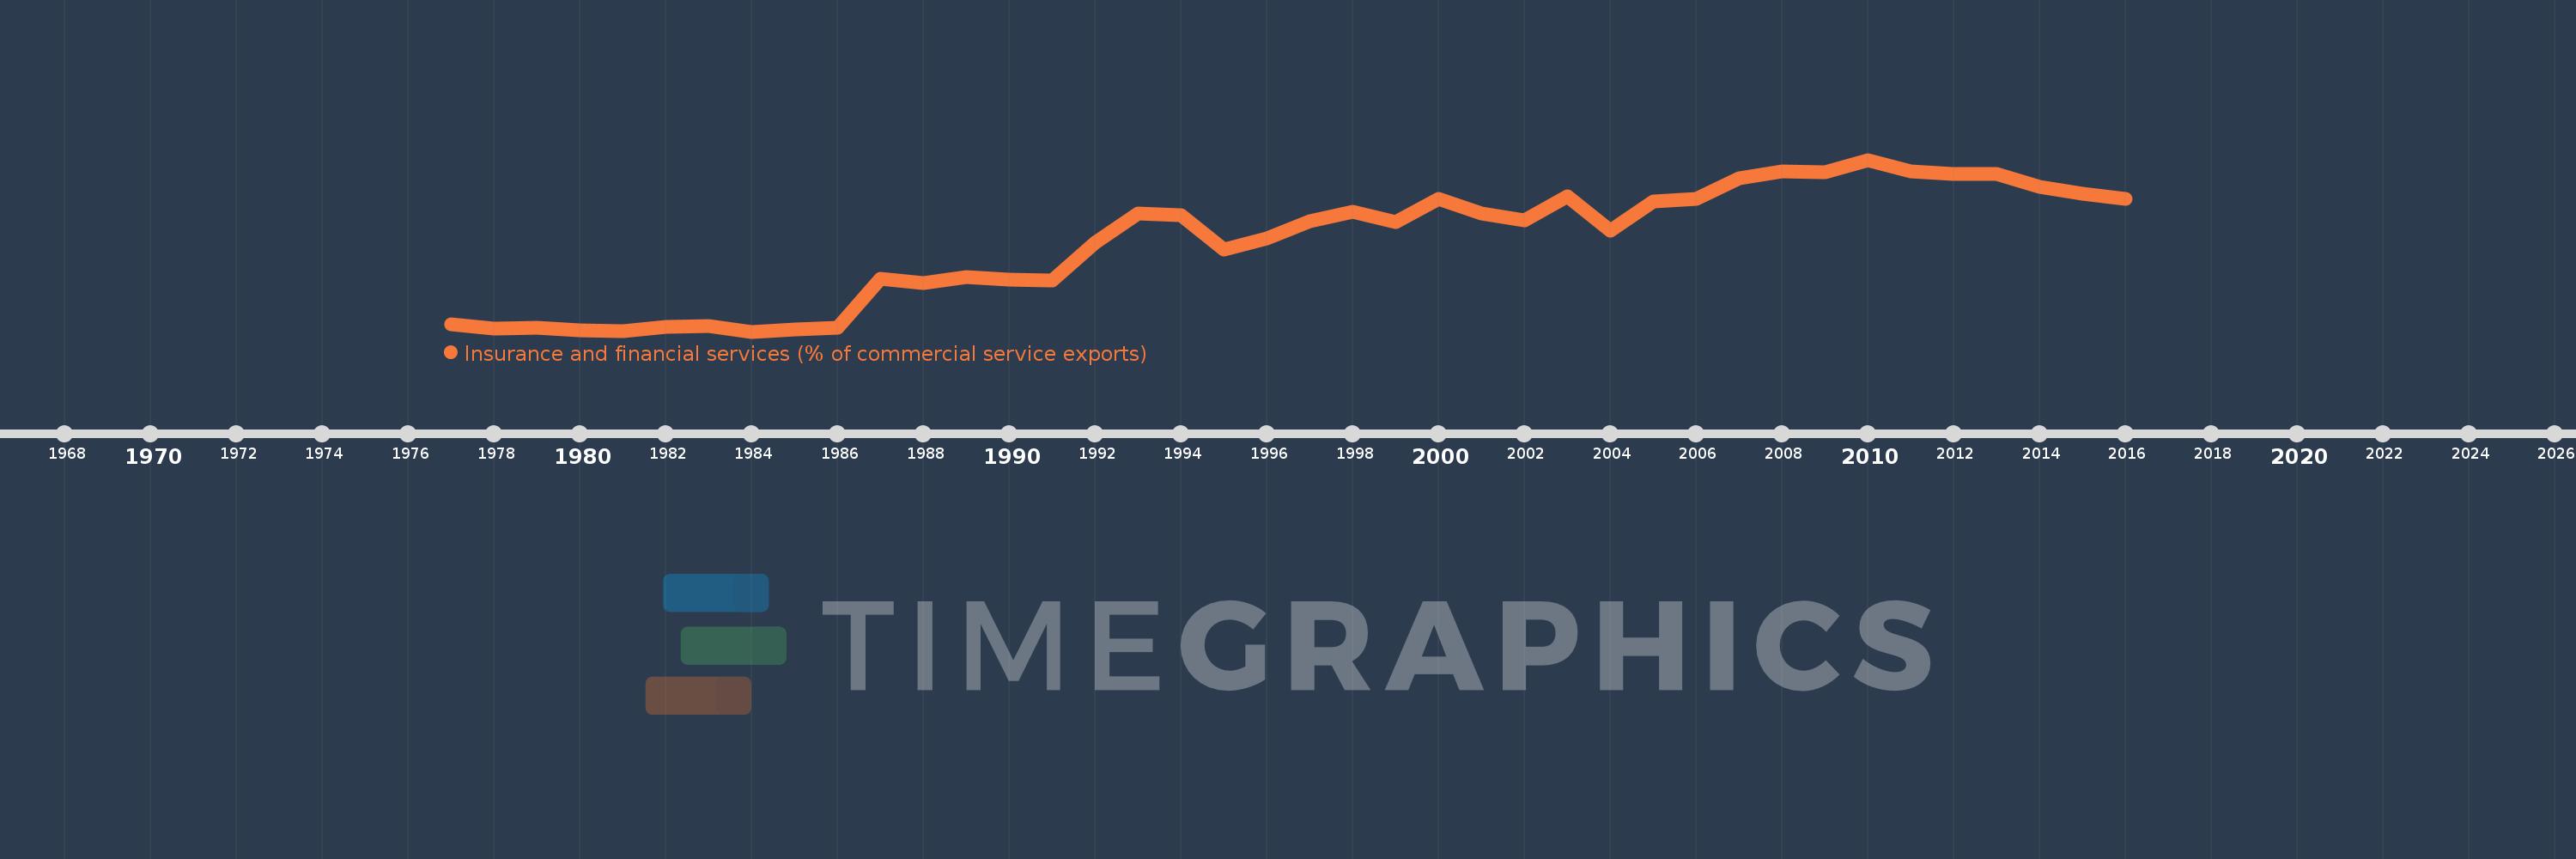
Insurance and financial services (% of commercial service exports)
2016,2015,2014,2013,2012,2011,2010,2009,2008,2007,2006,2005,2004,2003,2002,2001,2000,1999,1998,1997,1996,1995,1994,1993,1992,1991,1990,1989,1988,1987,1986,1985,1984,1983,1982,1981,1980,1979,1978,1977
This statistics in other country:
AfghanistanAlbaniaAlgeriaAngolaAntigua and BarbudaArab WorldArgentinaArmeniaArubaAustraliaAustriaAzerbaijanBahrainBangladeshBarbadosBelarusBelgiumBelizeBeninBermudaBhutanBoliviaBosnia and HerzegovinaBotswanaBrazilBrunei DarussalamBulgariaBurkina FasoBurundiCabo VerdeCambodiaCameroonCanadaCaribbean small statesCentral African RepublicCentral Europe and the BalticsChadChileChinaColombiaComorosCongo, Dem. Rep.Congo, Rep.Costa RicaCote d'IvoireCroatiaCuracaoCyprusCzech RepublicDenmarkDominicaDominican RepublicEarly-demographic dividendEast Asia & PacificEast Asia & Pacific (excluding high income)East Asia & Pacific (IDA & IBRD countries)EcuadorEgypt, Arab Rep.El SalvadorEritreaEstoniaEthiopiaEuro areaEurope & Central AsiaEurope & Central Asia (excluding high income)Europe & Central Asia (IDA & IBRD countries)European UnionFaroe IslandsFijiFinlandFragile and conflict affected situationsFranceFrench PolynesiaGabonGambia, TheGeorgiaGermanyGhanaGreeceGrenadaGuatemalaGuineaGuinea-BissauGuyanaHaitiHeavily indebted poor countries (HIPC)High incomeHondurasHong Kong SAR, ChinaHungaryIBRD onlyIcelandIDA & IBRD totalIDA onlyIDA totalIndiaIndonesiaIran, Islamic Rep.IraqIrelandIsraelItalyJamaicaJapanJordanKazakhstanKenyaKiribatiKorea, Rep.KosovoKuwaitKyrgyz RepublicLao PDRLate-demographic dividendLatin America & Caribbean Latin America & Caribbean (excluding high income)Latin America & the Caribbean (IDA & IBRD countries)LatviaLeast developed countries: UN classificationLebanonLesothoLiberiaLibyaLithuaniaLow & middle incomeLow incomeLower middle incomeLuxembourgMacao SAR, ChinaMacedonia, FYRMadagascarMalawiMalaysiaMaldivesMaliMaltaMauritaniaMauritiusMexicoMiddle East & North AfricaMiddle East & North Africa (excluding high income)Middle East & North Africa (IDA & IBRD countries)Middle incomeMoldovaMongoliaMontenegroMoroccoMozambiqueMyanmarNamibiaNepalNetherlandsNew CaledoniaNew ZealandNicaraguaNigerNigeriaNorth AmericaNorwayOECD membersOmanOther small statesPacific island small statesPakistanPalauPanamaPapua New GuineaParaguayPeruPhilippinesPolandPortugalPost-demographic dividendPre-demographic dividendQatarRomaniaRussian FederationRwandaSamoaSao Tome and PrincipeSaudi ArabiaSenegalSerbiaSeychellesSierra LeoneSingaporeSint Maarten (Dutch part)Slovak RepublicSloveniaSmall statesSolomon IslandsSouth AfricaSouth AsiaSouth Asia (IDA & IBRD)South SudanSpainSri LankaSt. Kitts and NevisSt. LuciaSt. Vincent and the GrenadinesSub-Saharan Africa Sub-Saharan Africa (excluding high income)Sub-Saharan Africa (IDA & IBRD countries)SudanSurinameSwazilandSwedenSwitzerlandSyrian Arab RepublicTajikistanTanzaniaThailandTimor-LesteTogoTongaTrinidad and TobagoTunisiaTurkeyTuvaluUgandaUkraineUnited KingdomUnited StatesUpper middle incomeUruguayVanuatuVenezuela, RBWest Bank and GazaWorldZambiaZimbabwe Timeline:
This timeline shows a graph from 1977 to 2016 of European Union. No data until 1976. Number of actual observations by date: 40.
Source name:
World Development Indicators
Source organization:
International Monetary Fund, Balance of Payments Statistics Yearbook and data files.
Categories, topics:
Private Sector, Trade
Last updated:
apr 23, 2017
Indicators value changes by year
Maximum:
11.658
jan 1, 2010
At the date of observation
Value
Absolute change
Change from previous value
jan 1, 1977
3.125
+3.125
0.0%
jan 1, 1978
2.907
-0.218
-6.98%
jan 1, 1979
2.948
+0.04
1.39%
jan 1, 1980
2.805
-0.142
-4.82%
jan 1, 1981
2.769
-0.037
-1.31%
jan 1, 1982
2.969
+0.2
7.22%
jan 1, 1983
2.999
+0.03
1.01%
jan 1, 1984
2.731
-0.267
-8.92%
jan 1, 1985
2.831
+0.1
3.67%
jan 1, 1986
2.934
+0.103
3.63%
jan 1, 1987
5.484
+2.549
86.88%
jan 1, 1988
5.242
-0.242
-4.41%
jan 1, 1989
5.566
+0.325
6.19%
jan 1, 1990
5.433
-0.133
-2.39%
jan 1, 1991
5.395
-0.039
-0.71%
jan 1, 1992
7.369
+1.974
36.59%
jan 1, 1993
8.868
+1.499
20.35%
jan 1, 1994
8.775
-0.093
-1.05%
jan 1, 1995
6.98
-1.795
-20.46%
jan 1, 1996
7.577
+0.597
8.55%
jan 1, 1997
8.458
+0.881
11.63%
jan 1, 1998
8.971
+0.514
6.07%
jan 1, 1999
8.407
-0.564
-6.29%
jan 1, 2000
9.632
+1.225
14.57%
jan 1, 2001
8.865
-0.767
-7.96%
jan 1, 2002
8.513
-0.353
-3.98%
jan 1, 2003
9.741
+1.229
14.43%
jan 1, 2004
7.988
-1.753
-18.0%
jan 1, 2005
9.476
+1.488
18.62%
jan 1, 2006
9.638
+0.162
1.71%
jan 1, 2007
10.704
+1.067
11.07%
jan 1, 2008
11.044
+0.339
3.17%
jan 1, 2009
11.023
-0.02
-0.18%
jan 1, 2010
11.658
+0.635
5.76%
jan 1, 2011
11.055
-0.604
-5.18%
jan 1, 2012
10.936
-0.119
-1.08%
jan 1, 2013
10.907
-0.029
-0.26%
jan 1, 2014
10.272
-0.635
-5.83%
jan 1, 2015
9.877
-0.395
-3.85%
jan 1, 2016
9.615
-0.261
-2.65%
Ranking of countries by current statistics by years


Comments: