29
/
en
AIzaSyAYiBZKx7MnpbEhh9jyipgxe19OcubqV5w
April 1, 2024
233727
Sao Tome and Principe
STP
true
2
1
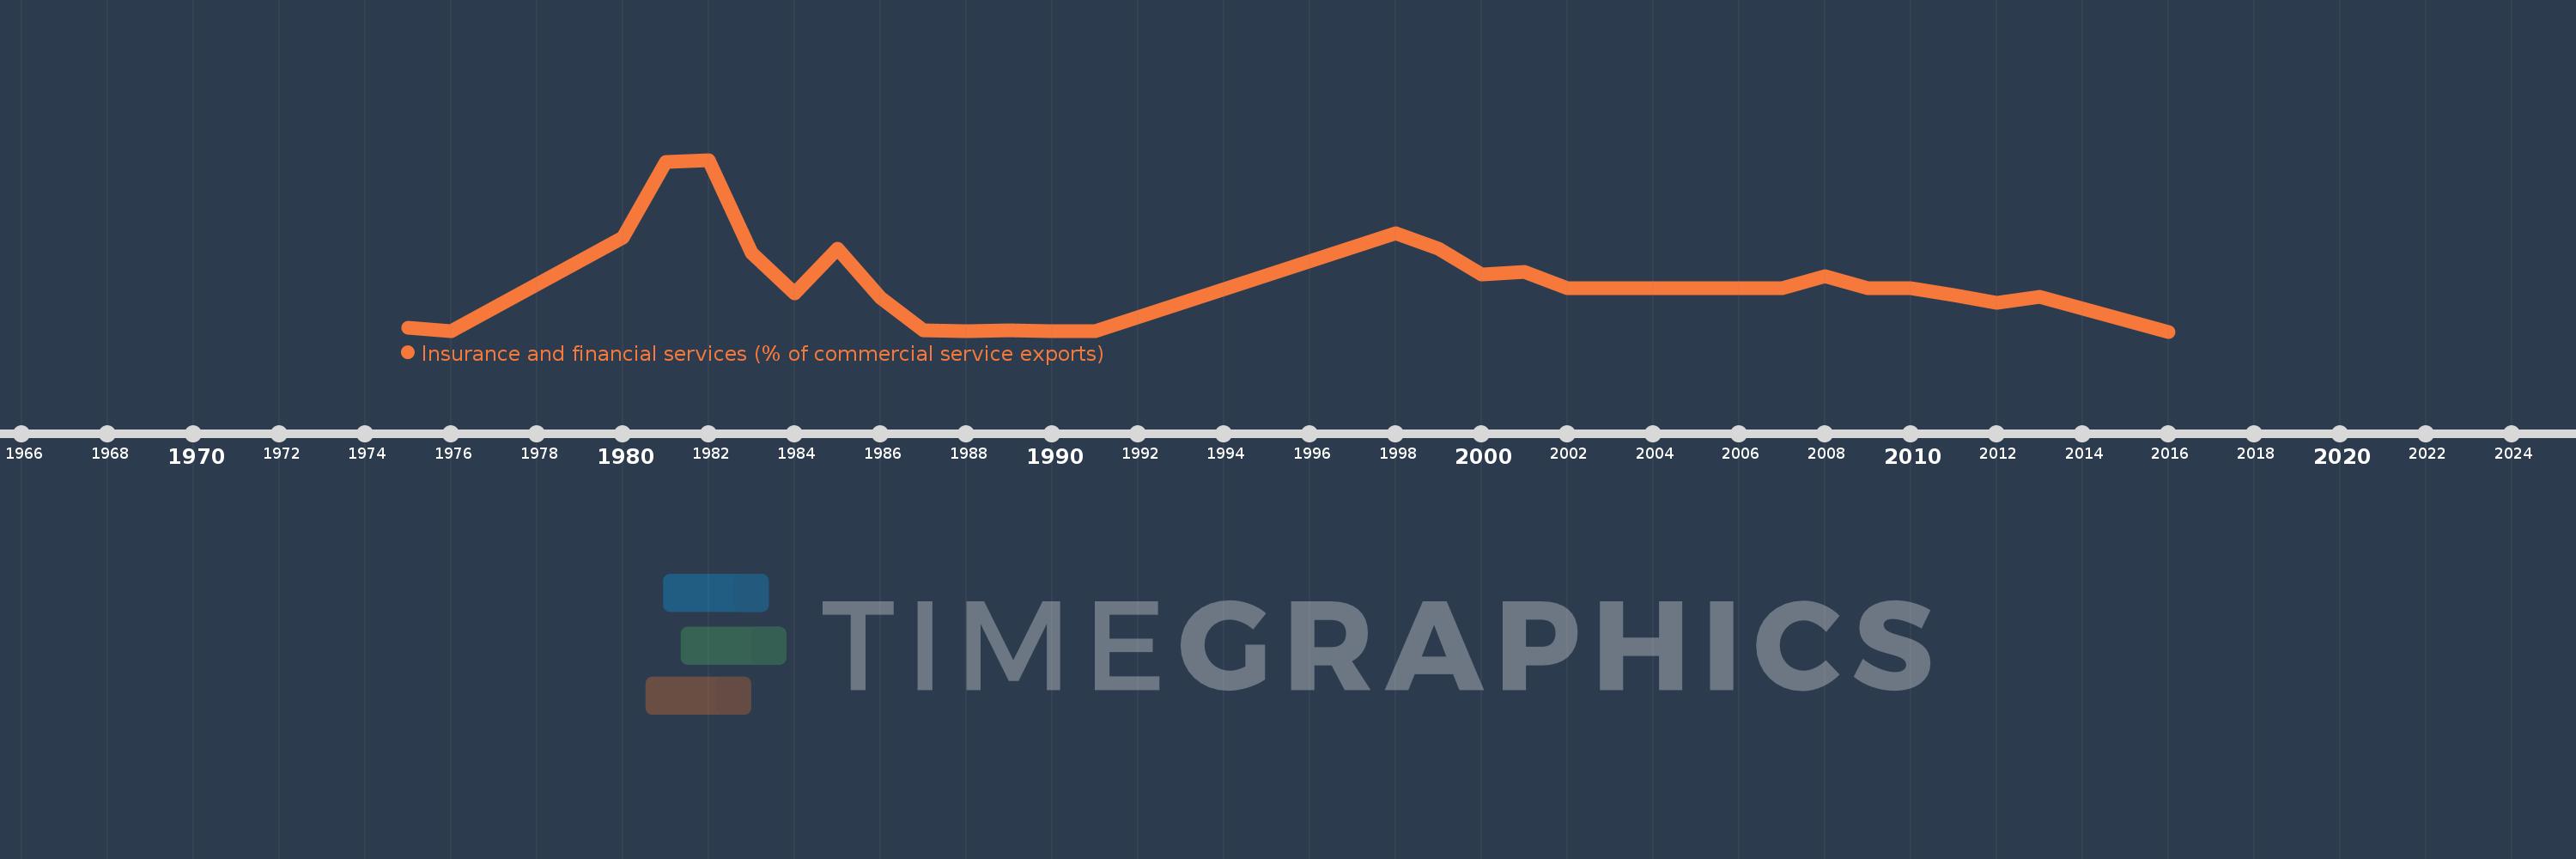
Insurance and financial services (% of commercial service exports)
2016,2013,2012,2011,2010,2009,2008,2007,2006,2005,2004,2003,2002,2001,2000,1999,1998,1991,1990,1989,1988,1987,1986,1985,1984,1983,1982,1981,1980,1976,1975
This statistics in other country:
AfghanistanAlbaniaAlgeriaAngolaAntigua and BarbudaArab WorldArgentinaArmeniaArubaAustraliaAustriaAzerbaijanBahrainBangladeshBarbadosBelarusBelgiumBelizeBeninBermudaBhutanBoliviaBosnia and HerzegovinaBotswanaBrazilBrunei DarussalamBulgariaBurkina FasoBurundiCabo VerdeCambodiaCameroonCanadaCaribbean small statesCentral African RepublicCentral Europe and the BalticsChadChileChinaColombiaComorosCongo, Dem. Rep.Congo, Rep.Costa RicaCote d'IvoireCroatiaCuracaoCyprusCzech RepublicDenmarkDominicaDominican RepublicEarly-demographic dividendEast Asia & PacificEast Asia & Pacific (excluding high income)East Asia & Pacific (IDA & IBRD countries)EcuadorEgypt, Arab Rep.El SalvadorEritreaEstoniaEthiopiaEuro areaEurope & Central AsiaEurope & Central Asia (excluding high income)Europe & Central Asia (IDA & IBRD countries)European UnionFaroe IslandsFijiFinlandFragile and conflict affected situationsFranceFrench PolynesiaGabonGambia, TheGeorgiaGermanyGhanaGreeceGrenadaGuatemalaGuineaGuinea-BissauGuyanaHaitiHeavily indebted poor countries (HIPC)High incomeHondurasHong Kong SAR, ChinaHungaryIBRD onlyIcelandIDA & IBRD totalIDA onlyIDA totalIndiaIndonesiaIran, Islamic Rep.IraqIrelandIsraelItalyJamaicaJapanJordanKazakhstanKenyaKiribatiKorea, Rep.KosovoKuwaitKyrgyz RepublicLao PDRLate-demographic dividendLatin America & Caribbean Latin America & Caribbean (excluding high income)Latin America & the Caribbean (IDA & IBRD countries)LatviaLeast developed countries: UN classificationLebanonLesothoLiberiaLibyaLithuaniaLow & middle incomeLow incomeLower middle incomeLuxembourgMacao SAR, ChinaMacedonia, FYRMadagascarMalawiMalaysiaMaldivesMaliMaltaMauritaniaMauritiusMexicoMiddle East & North AfricaMiddle East & North Africa (excluding high income)Middle East & North Africa (IDA & IBRD countries)Middle incomeMoldovaMongoliaMontenegroMoroccoMozambiqueMyanmarNamibiaNepalNetherlandsNew CaledoniaNew ZealandNicaraguaNigerNigeriaNorth AmericaNorwayOECD membersOmanOther small statesPacific island small statesPakistanPalauPanamaPapua New GuineaParaguayPeruPhilippinesPolandPortugalPost-demographic dividendPre-demographic dividendQatarRomaniaRussian FederationRwandaSamoaSao Tome and PrincipeSaudi ArabiaSenegalSerbiaSeychellesSierra LeoneSingaporeSint Maarten (Dutch part)Slovak RepublicSloveniaSmall statesSolomon IslandsSouth AfricaSouth AsiaSouth Asia (IDA & IBRD)South SudanSpainSri LankaSt. Kitts and NevisSt. LuciaSt. Vincent and the GrenadinesSub-Saharan Africa Sub-Saharan Africa (excluding high income)Sub-Saharan Africa (IDA & IBRD countries)SudanSurinameSwazilandSwedenSwitzerlandSyrian Arab RepublicTajikistanTanzaniaThailandTimor-LesteTogoTongaTrinidad and TobagoTunisiaTurkeyTuvaluUgandaUkraineUnited KingdomUnited StatesUpper middle incomeUruguayVanuatuVenezuela, RBWest Bank and GazaWorldZambiaZimbabwe Timeline:
This timeline shows a graph from 1975 to 2016 of Sao Tome and Principe. No data until 1974. Number of actual observations by date: 31.
Source name:
World Development Indicators
Source organization:
International Monetary Fund, Balance of Payments Statistics Yearbook and data files.
Categories, topics:
Private Sector, Trade
Last updated:
apr 23, 2017
Indicators value changes by year
Maximum:
14.398
jan 1, 1982
At the date of observation
Value
Absolute change
Change from previous value
jan 1, 1975
0.305
+0.305
0.0%
jan 1, 1976
0.064
-0.241
-79.03%
jan 1, 1980
7.917
+7.853
12.29K%
jan 1, 1981
14.209
+6.292
79.48%
jan 1, 1982
14.398
+0.189
1.33%
jan 1, 1983
6.582
-7.816
-54.29%
jan 1, 1984
3.18
-3.402
-51.69%
jan 1, 1985
6.921
+3.742
117.66%
jan 1, 1986
2.816
-4.105
-59.31%
jan 1, 1987
0.137
-2.679
-95.12%
jan 1, 1988
0.045
-0.093
-67.41%
jan 1, 1989
0.103
+0.058
130.34%
jan 1, 1990
0.013
-0.09
-87.14%
jan 1, 1991
0.069
+0.056
421.63%
jan 1, 1998
8.271
+8.201
11.85K%
jan 1, 1999
6.974
-1.297
-15.68%
jan 1, 2000
4.828
-2.146
-30.77%
jan 1, 2001
5.008
+0.179
3.72%
jan 1, 2002
3.64
-1.367
-27.31%
jan 1, 2003
3.64
+0.0
0.0%
jan 1, 2005
3.64
+0.0
0.0%
jan 1, 2008
4.66
+1.019
28.0%
jan 1, 2009
3.64
-1.019
-21.88%
jan 1, 2010
3.651
+0.011
0.3%
jan 1, 2011
3.044
-0.608
-16.64%
jan 1, 2012
2.414
-0.63
-20.69%
jan 1, 2013
2.933
+0.518
21.48%
jan 1, 2016
0.009
-2.924
-99.71%
Ranking of countries by current statistics by years


Comments: