29
/
en
AIzaSyAYiBZKx7MnpbEhh9jyipgxe19OcubqV5w
April 1, 2024
140543
Ghana
GHA
true
2
1
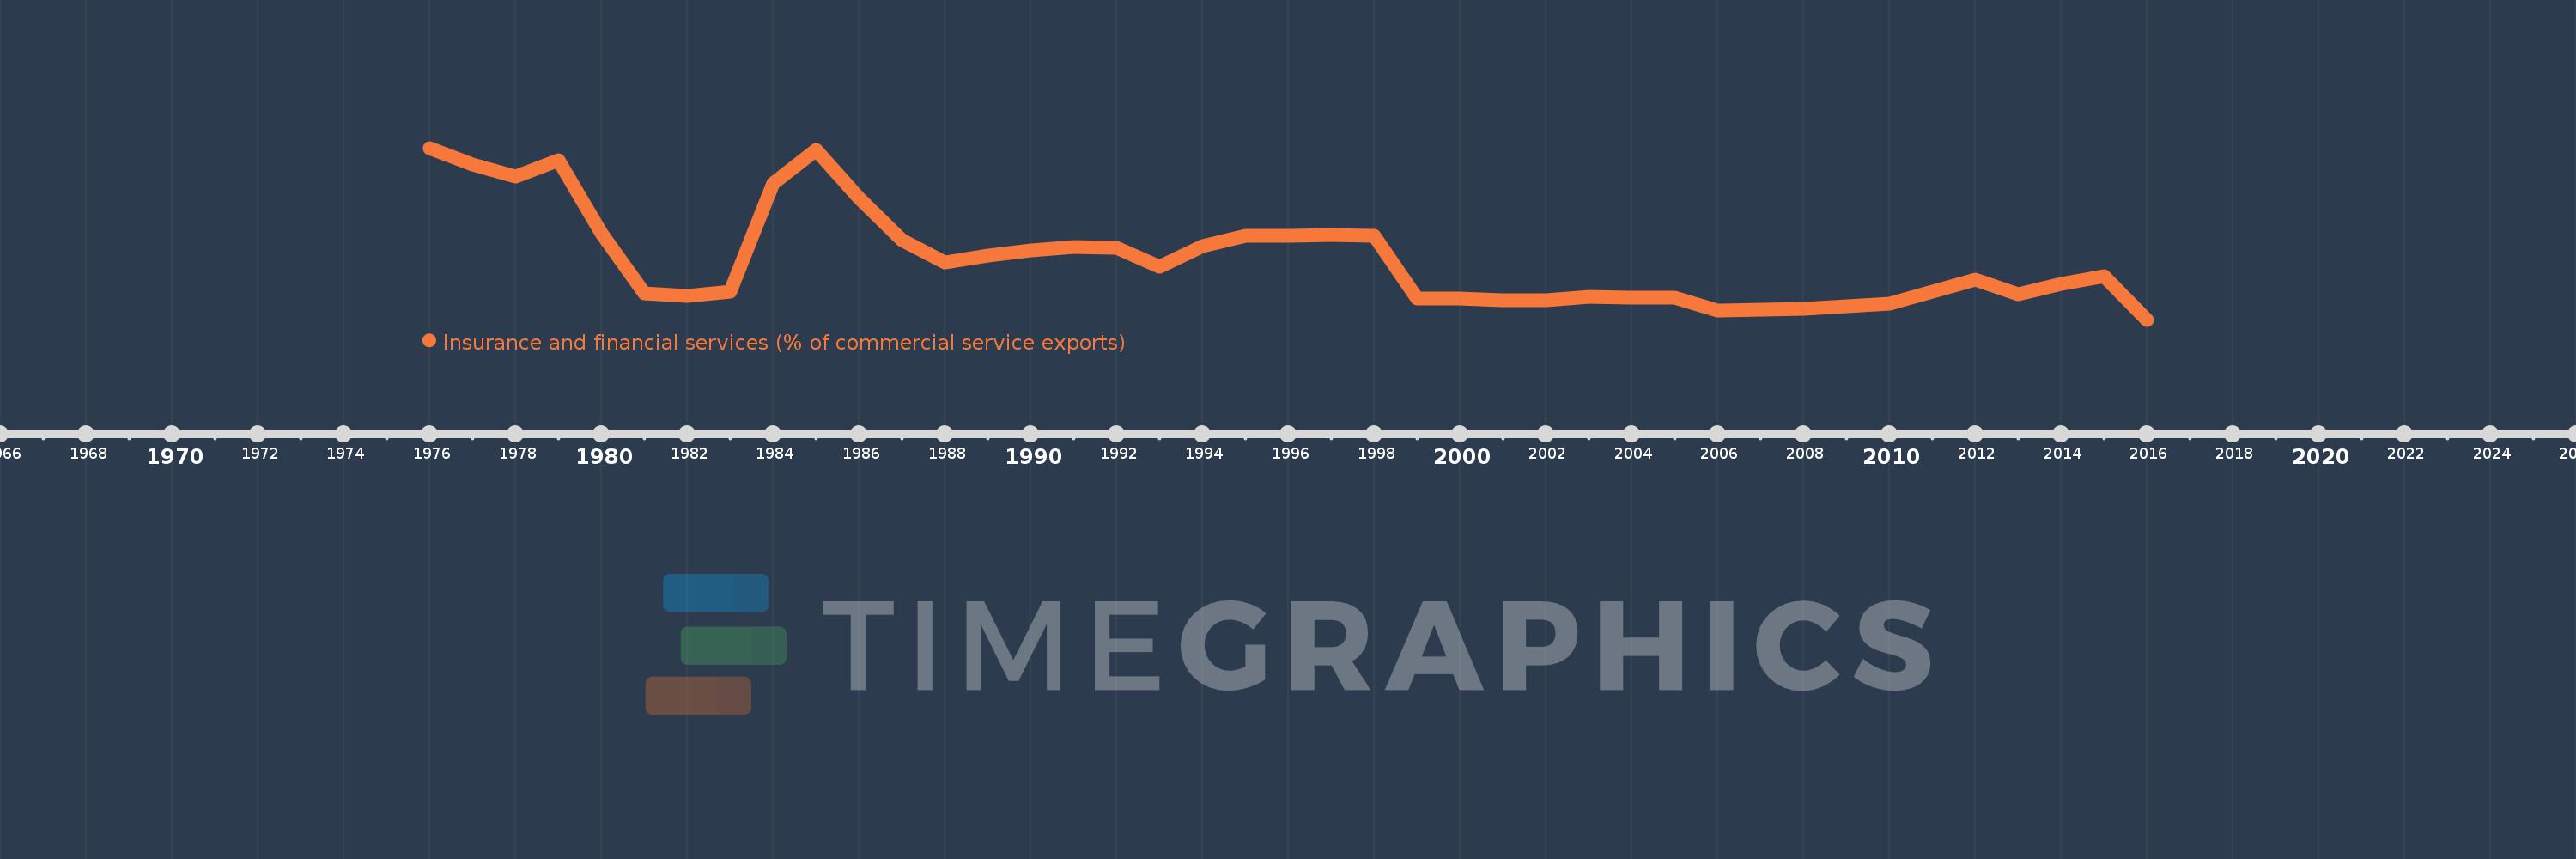
Insurance and financial services (% of commercial service exports)
2016,2015,2014,2013,2012,2011,2010,2009,2008,2007,2006,2005,2004,2003,2002,2001,2000,1999,1998,1997,1996,1995,1994,1993,1992,1991,1990,1989,1988,1987,1986,1985,1984,1983,1982,1981,1980,1979,1978,1977,1976
This statistics in other country:
AfghanistanAlbaniaAlgeriaAngolaAntigua and BarbudaArab WorldArgentinaArmeniaArubaAustraliaAustriaAzerbaijanBahrainBangladeshBarbadosBelarusBelgiumBelizeBeninBermudaBhutanBoliviaBosnia and HerzegovinaBotswanaBrazilBrunei DarussalamBulgariaBurkina FasoBurundiCabo VerdeCambodiaCameroonCanadaCaribbean small statesCentral African RepublicCentral Europe and the BalticsChadChileChinaColombiaComorosCongo, Dem. Rep.Congo, Rep.Costa RicaCote d'IvoireCroatiaCuracaoCyprusCzech RepublicDenmarkDominicaDominican RepublicEarly-demographic dividendEast Asia & PacificEast Asia & Pacific (excluding high income)East Asia & Pacific (IDA & IBRD countries)EcuadorEgypt, Arab Rep.El SalvadorEritreaEstoniaEthiopiaEuro areaEurope & Central AsiaEurope & Central Asia (excluding high income)Europe & Central Asia (IDA & IBRD countries)European UnionFaroe IslandsFijiFinlandFragile and conflict affected situationsFranceFrench PolynesiaGabonGambia, TheGeorgiaGermanyGhanaGreeceGrenadaGuatemalaGuineaGuinea-BissauGuyanaHaitiHeavily indebted poor countries (HIPC)High incomeHondurasHong Kong SAR, ChinaHungaryIBRD onlyIcelandIDA & IBRD totalIDA onlyIDA totalIndiaIndonesiaIran, Islamic Rep.IraqIrelandIsraelItalyJamaicaJapanJordanKazakhstanKenyaKiribatiKorea, Rep.KosovoKuwaitKyrgyz RepublicLao PDRLate-demographic dividendLatin America & Caribbean Latin America & Caribbean (excluding high income)Latin America & the Caribbean (IDA & IBRD countries)LatviaLeast developed countries: UN classificationLebanonLesothoLiberiaLibyaLithuaniaLow & middle incomeLow incomeLower middle incomeLuxembourgMacao SAR, ChinaMacedonia, FYRMadagascarMalawiMalaysiaMaldivesMaliMaltaMauritaniaMauritiusMexicoMiddle East & North AfricaMiddle East & North Africa (excluding high income)Middle East & North Africa (IDA & IBRD countries)Middle incomeMoldovaMongoliaMontenegroMoroccoMozambiqueMyanmarNamibiaNepalNetherlandsNew CaledoniaNew ZealandNicaraguaNigerNigeriaNorth AmericaNorwayOECD membersOmanOther small statesPacific island small statesPakistanPalauPanamaPapua New GuineaParaguayPeruPhilippinesPolandPortugalPost-demographic dividendPre-demographic dividendQatarRomaniaRussian FederationRwandaSamoaSao Tome and PrincipeSaudi ArabiaSenegalSerbiaSeychellesSierra LeoneSingaporeSint Maarten (Dutch part)Slovak RepublicSloveniaSmall statesSolomon IslandsSouth AfricaSouth AsiaSouth Asia (IDA & IBRD)South SudanSpainSri LankaSt. Kitts and NevisSt. LuciaSt. Vincent and the GrenadinesSub-Saharan Africa Sub-Saharan Africa (excluding high income)Sub-Saharan Africa (IDA & IBRD countries)SudanSurinameSwazilandSwedenSwitzerlandSyrian Arab RepublicTajikistanTanzaniaThailandTimor-LesteTogoTongaTrinidad and TobagoTunisiaTurkeyTuvaluUgandaUkraineUnited KingdomUnited StatesUpper middle incomeUruguayVanuatuVenezuela, RBWest Bank and GazaWorldZambiaZimbabwe Timeline:
This timeline shows a graph from 1976 to 2016 of Ghana. No data until 1975. Number of actual observations by date: 41.
Source name:
World Development Indicators
Source organization:
International Monetary Fund, Balance of Payments Statistics Yearbook and data files.
Categories, topics:
Private Sector, Trade
Last updated:
apr 23, 2017
Indicators value changes by year
At the date of observation
Value
Absolute change
Change from previous value
jan 1, 1976
5.67
+5.67
0.0%
jan 1, 1977
5.167
-0.504
-8.88%
jan 1, 1978
4.797
-0.37
-7.16%
jan 1, 1979
5.292
+0.495
10.32%
jan 1, 1980
3.09
-2.202
-41.62%
jan 1, 1981
1.254
-1.836
-59.42%
jan 1, 1982
1.181
-0.073
-5.83%
jan 1, 1983
1.296
+0.116
9.8%
jan 1, 1984
4.598
+3.301
254.7%
jan 1, 1985
5.612
+1.015
22.07%
jan 1, 1986
4.14
-1.472
-26.23%
jan 1, 1987
2.876
-1.265
-30.54%
jan 1, 1988
2.189
-0.687
-23.88%
jan 1, 1989
2.411
+0.223
10.17%
jan 1, 1990
2.564
+0.153
6.33%
jan 1, 1991
2.662
+0.097
3.8%
jan 1, 1992
2.643
-0.019
-0.71%
jan 1, 1993
2.075
-0.568
-21.49%
jan 1, 1994
2.699
+0.624
30.07%
jan 1, 1995
3.015
+0.316
11.71%
jan 1, 1996
3.004
-0.011
-0.37%
jan 1, 1997
3.017
+0.013
0.43%
jan 1, 1998
2.991
-0.026
-0.86%
jan 1, 1999
1.112
-1.879
-62.82%
jan 1, 2000
1.093
-0.019
-1.68%
jan 1, 2001
1.05
-0.044
-3.99%
jan 1, 2002
1.054
+0.005
0.46%
jan 1, 2003
1.143
+0.089
8.43%
jan 1, 2004
1.117
-0.026
-2.26%
jan 1, 2005
1.127
+0.009
0.82%
jan 1, 2006
0.746
-0.381
-33.82%
jan 1, 2007
0.768
+0.022
2.94%
jan 1, 2008
0.779
+0.012
1.53%
jan 1, 2009
0.86
+0.08
10.31%
jan 1, 2010
0.938
+0.078
9.07%
jan 1, 2011
1.315
+0.377
40.24%
jan 1, 2012
1.685
+0.37
28.17%
jan 1, 2013
1.22
-0.465
-27.6%
jan 1, 2014
1.543
+0.323
26.44%
jan 1, 2015
1.764
+0.221
14.35%
jan 1, 2016
0.455
-1.309
-74.23%
Ranking of countries by current statistics by years


Comments: