29
/
en
AIzaSyAYiBZKx7MnpbEhh9jyipgxe19OcubqV5w
April 1, 2024
124949
Egypt, Arab Rep.
EGY
true
2
1
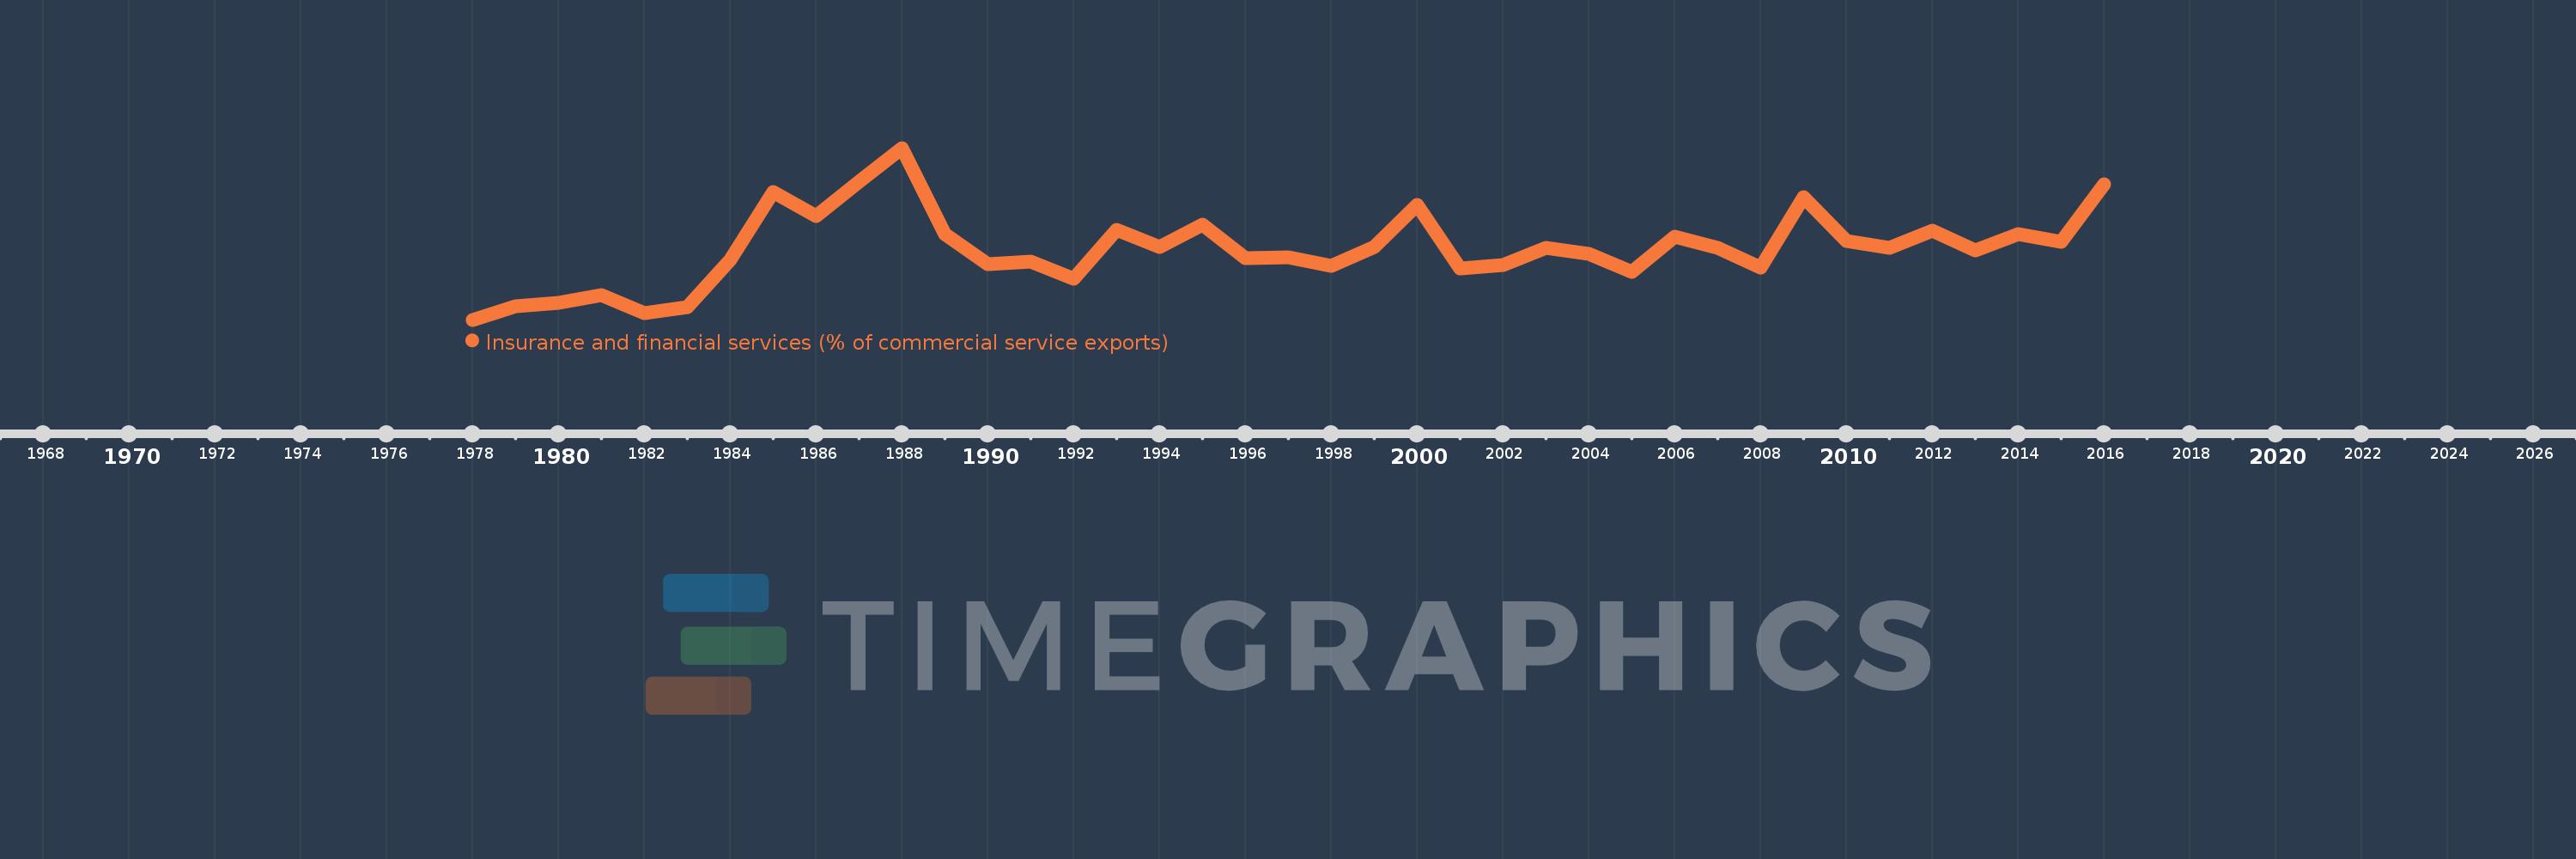
Insurance and financial services (% of commercial service exports)
2016,2015,2014,2013,2012,2011,2010,2009,2008,2007,2006,2005,2004,2003,2002,2001,2000,1999,1998,1997,1996,1995,1994,1993,1992,1991,1990,1989,1988,1987,1986,1985,1984,1983,1982,1981,1980,1979,1978
This statistics in other country:
AfghanistanAlbaniaAlgeriaAngolaAntigua and BarbudaArab WorldArgentinaArmeniaArubaAustraliaAustriaAzerbaijanBahrainBangladeshBarbadosBelarusBelgiumBelizeBeninBermudaBhutanBoliviaBosnia and HerzegovinaBotswanaBrazilBrunei DarussalamBulgariaBurkina FasoBurundiCabo VerdeCambodiaCameroonCanadaCaribbean small statesCentral African RepublicCentral Europe and the BalticsChadChileChinaColombiaComorosCongo, Dem. Rep.Congo, Rep.Costa RicaCote d'IvoireCroatiaCuracaoCyprusCzech RepublicDenmarkDominicaDominican RepublicEarly-demographic dividendEast Asia & PacificEast Asia & Pacific (excluding high income)East Asia & Pacific (IDA & IBRD countries)EcuadorEgypt, Arab Rep.El SalvadorEritreaEstoniaEthiopiaEuro areaEurope & Central AsiaEurope & Central Asia (excluding high income)Europe & Central Asia (IDA & IBRD countries)European UnionFaroe IslandsFijiFinlandFragile and conflict affected situationsFranceFrench PolynesiaGabonGambia, TheGeorgiaGermanyGhanaGreeceGrenadaGuatemalaGuineaGuinea-BissauGuyanaHaitiHeavily indebted poor countries (HIPC)High incomeHondurasHong Kong SAR, ChinaHungaryIBRD onlyIcelandIDA & IBRD totalIDA onlyIDA totalIndiaIndonesiaIran, Islamic Rep.IraqIrelandIsraelItalyJamaicaJapanJordanKazakhstanKenyaKiribatiKorea, Rep.KosovoKuwaitKyrgyz RepublicLao PDRLate-demographic dividendLatin America & Caribbean Latin America & Caribbean (excluding high income)Latin America & the Caribbean (IDA & IBRD countries)LatviaLeast developed countries: UN classificationLebanonLesothoLiberiaLibyaLithuaniaLow & middle incomeLow incomeLower middle incomeLuxembourgMacao SAR, ChinaMacedonia, FYRMadagascarMalawiMalaysiaMaldivesMaliMaltaMauritaniaMauritiusMexicoMiddle East & North AfricaMiddle East & North Africa (excluding high income)Middle East & North Africa (IDA & IBRD countries)Middle incomeMoldovaMongoliaMontenegroMoroccoMozambiqueMyanmarNamibiaNepalNetherlandsNew CaledoniaNew ZealandNicaraguaNigerNigeriaNorth AmericaNorwayOECD membersOmanOther small statesPacific island small statesPakistanPalauPanamaPapua New GuineaParaguayPeruPhilippinesPolandPortugalPost-demographic dividendPre-demographic dividendQatarRomaniaRussian FederationRwandaSamoaSao Tome and PrincipeSaudi ArabiaSenegalSerbiaSeychellesSierra LeoneSingaporeSint Maarten (Dutch part)Slovak RepublicSloveniaSmall statesSolomon IslandsSouth AfricaSouth AsiaSouth Asia (IDA & IBRD)South SudanSpainSri LankaSt. Kitts and NevisSt. LuciaSt. Vincent and the GrenadinesSub-Saharan Africa Sub-Saharan Africa (excluding high income)Sub-Saharan Africa (IDA & IBRD countries)SudanSurinameSwazilandSwedenSwitzerlandSyrian Arab RepublicTajikistanTanzaniaThailandTimor-LesteTogoTongaTrinidad and TobagoTunisiaTurkeyTuvaluUgandaUkraineUnited KingdomUnited StatesUpper middle incomeUruguayVanuatuVenezuela, RBWest Bank and GazaWorldZambiaZimbabwe Timeline:
This timeline shows a graph from 1978 to 2016 of Egypt, Arab Rep.. No data until 1977. Number of actual observations by date: 39.
Source name:
World Development Indicators
Source organization:
International Monetary Fund, Balance of Payments Statistics Yearbook and data files.
Categories, topics:
Private Sector, Trade
Last updated:
apr 23, 2017
Indicators value changes by year
At the date of observation
Value
Absolute change
Change from previous value
jan 1, 1978
0.034
+0.034
0.0%
jan 1, 1979
0.25
+0.217
644.49%
jan 1, 1980
0.301
+0.051
20.38%
jan 1, 1981
0.419
+0.117
38.89%
jan 1, 1982
0.141
-0.278
-66.3%
jan 1, 1983
0.228
+0.087
61.37%
jan 1, 1984
0.981
+0.754
331.02%
jan 1, 1985
2.053
+1.072
109.2%
jan 1, 1986
1.669
-0.383
-18.67%
jan 1, 1987
2.205
+0.536
32.08%
jan 1, 1988
2.744
+0.539
24.42%
jan 1, 1989
1.388
-1.355
-49.4%
jan 1, 1990
0.908
-0.48
-34.56%
jan 1, 1991
0.956
+0.047
5.22%
jan 1, 1992
0.684
-0.272
-28.44%
jan 1, 1993
1.446
+0.762
111.39%
jan 1, 1994
1.187
-0.259
-17.9%
jan 1, 1995
1.534
+0.347
29.21%
jan 1, 1996
1.005
-0.529
-34.51%
jan 1, 1997
1.024
+0.02
1.97%
jan 1, 1998
0.89
-0.134
-13.07%
jan 1, 1999
1.187
+0.297
33.35%
jan 1, 2000
1.85
+0.662
55.79%
jan 1, 2001
0.846
-1.003
-54.24%
jan 1, 2002
0.903
+0.056
6.67%
jan 1, 2003
1.169
+0.266
29.47%
jan 1, 2004
1.073
-0.096
-8.21%
jan 1, 2005
0.795
-0.278
-25.9%
jan 1, 2006
1.351
+0.556
69.89%
jan 1, 2007
1.17
-0.181
-13.42%
jan 1, 2008
0.851
-0.318
-27.2%
jan 1, 2009
1.967
+1.116
131.05%
jan 1, 2010
1.271
-0.696
-35.38%
jan 1, 2011
1.173
-0.098
-7.71%
jan 1, 2012
1.436
+0.263
22.4%
jan 1, 2013
1.131
-0.305
-21.25%
jan 1, 2014
1.379
+0.248
21.94%
jan 1, 2015
1.265
-0.114
-8.28%
jan 1, 2016
2.166
+0.901
71.24%
Ranking of countries by current statistics by years


Comments: