29
/
en
AIzaSyAYiBZKx7MnpbEhh9jyipgxe19OcubqV5w
April 1, 2024
154763
India
IND
true
2
1
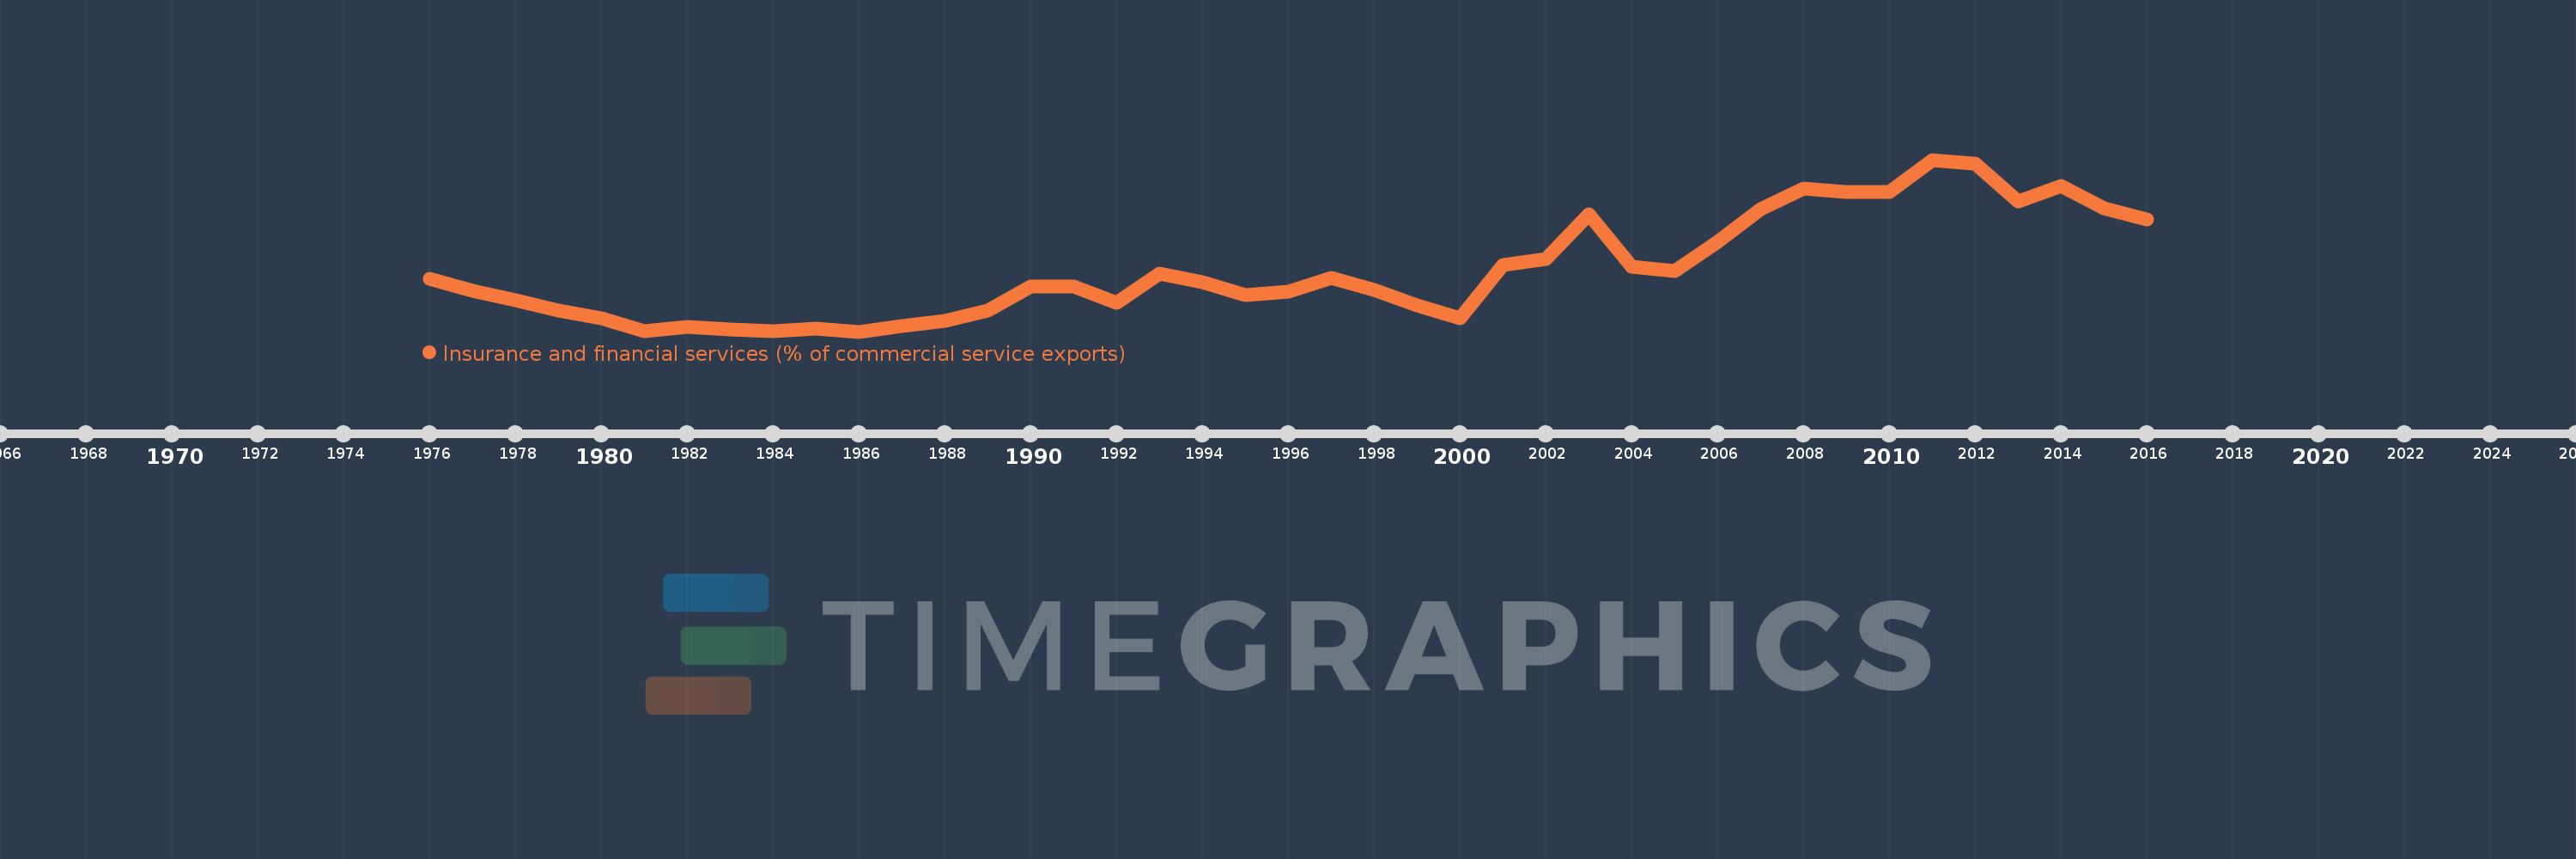
Insurance and financial services (% of commercial service exports)
2016,2015,2014,2013,2012,2011,2010,2009,2008,2007,2006,2005,2004,2003,2002,2001,2000,1999,1998,1997,1996,1995,1994,1993,1992,1991,1990,1989,1988,1987,1986,1985,1984,1983,1982,1981,1980,1979,1978,1977,1976
This statistics in other country:
AfghanistanAlbaniaAlgeriaAngolaAntigua and BarbudaArab WorldArgentinaArmeniaArubaAustraliaAustriaAzerbaijanBahrainBangladeshBarbadosBelarusBelgiumBelizeBeninBermudaBhutanBoliviaBosnia and HerzegovinaBotswanaBrazilBrunei DarussalamBulgariaBurkina FasoBurundiCabo VerdeCambodiaCameroonCanadaCaribbean small statesCentral African RepublicCentral Europe and the BalticsChadChileChinaColombiaComorosCongo, Dem. Rep.Congo, Rep.Costa RicaCote d'IvoireCroatiaCuracaoCyprusCzech RepublicDenmarkDominicaDominican RepublicEarly-demographic dividendEast Asia & PacificEast Asia & Pacific (excluding high income)East Asia & Pacific (IDA & IBRD countries)EcuadorEgypt, Arab Rep.El SalvadorEritreaEstoniaEthiopiaEuro areaEurope & Central AsiaEurope & Central Asia (excluding high income)Europe & Central Asia (IDA & IBRD countries)European UnionFaroe IslandsFijiFinlandFragile and conflict affected situationsFranceFrench PolynesiaGabonGambia, TheGeorgiaGermanyGhanaGreeceGrenadaGuatemalaGuineaGuinea-BissauGuyanaHaitiHeavily indebted poor countries (HIPC)High incomeHondurasHong Kong SAR, ChinaHungaryIBRD onlyIcelandIDA & IBRD totalIDA onlyIDA totalIndiaIndonesiaIran, Islamic Rep.IraqIrelandIsraelItalyJamaicaJapanJordanKazakhstanKenyaKiribatiKorea, Rep.KosovoKuwaitKyrgyz RepublicLao PDRLate-demographic dividendLatin America & Caribbean Latin America & Caribbean (excluding high income)Latin America & the Caribbean (IDA & IBRD countries)LatviaLeast developed countries: UN classificationLebanonLesothoLiberiaLibyaLithuaniaLow & middle incomeLow incomeLower middle incomeLuxembourgMacao SAR, ChinaMacedonia, FYRMadagascarMalawiMalaysiaMaldivesMaliMaltaMauritaniaMauritiusMexicoMiddle East & North AfricaMiddle East & North Africa (excluding high income)Middle East & North Africa (IDA & IBRD countries)Middle incomeMoldovaMongoliaMontenegroMoroccoMozambiqueMyanmarNamibiaNepalNetherlandsNew CaledoniaNew ZealandNicaraguaNigerNigeriaNorth AmericaNorwayOECD membersOmanOther small statesPacific island small statesPakistanPalauPanamaPapua New GuineaParaguayPeruPhilippinesPolandPortugalPost-demographic dividendPre-demographic dividendQatarRomaniaRussian FederationRwandaSamoaSao Tome and PrincipeSaudi ArabiaSenegalSerbiaSeychellesSierra LeoneSingaporeSint Maarten (Dutch part)Slovak RepublicSloveniaSmall statesSolomon IslandsSouth AfricaSouth AsiaSouth Asia (IDA & IBRD)South SudanSpainSri LankaSt. Kitts and NevisSt. LuciaSt. Vincent and the GrenadinesSub-Saharan Africa Sub-Saharan Africa (excluding high income)Sub-Saharan Africa (IDA & IBRD countries)SudanSurinameSwazilandSwedenSwitzerlandSyrian Arab RepublicTajikistanTanzaniaThailandTimor-LesteTogoTongaTrinidad and TobagoTunisiaTurkeyTuvaluUgandaUkraineUnited KingdomUnited StatesUpper middle incomeUruguayVanuatuVenezuela, RBWest Bank and GazaWorldZambiaZimbabwe Timeline:
This timeline shows a graph from 1976 to 2016 of India. No data until 1975. Number of actual observations by date: 41.
Source name:
World Development Indicators
Source organization:
International Monetary Fund, Balance of Payments Statistics Yearbook and data files.
Categories, topics:
Private Sector, Trade
Last updated:
apr 23, 2017
Indicators value changes by year
At the date of observation
Value
Absolute change
Change from previous value
jan 1, 1976
2.891
+2.891
0.0%
jan 1, 1977
2.524
-0.367
-12.69%
jan 1, 1978
2.254
-0.27
-10.69%
jan 1, 1979
1.94
-0.315
-13.96%
jan 1, 1980
1.701
-0.239
-12.3%
jan 1, 1981
1.293
-0.408
-24.0%
jan 1, 1982
1.429
+0.136
10.53%
jan 1, 1983
1.355
-0.074
-5.15%
jan 1, 1984
1.304
-0.052
-3.8%
jan 1, 1985
1.379
+0.075
5.78%
jan 1, 1986
1.288
-0.092
-6.64%
jan 1, 1987
1.456
+0.169
13.09%
jan 1, 1988
1.619
+0.162
11.16%
jan 1, 1989
1.919
+0.301
18.59%
jan 1, 1990
2.676
+0.757
39.43%
jan 1, 1991
2.675
-0.001
-0.05%
jan 1, 1992
2.174
-0.501
-18.73%
jan 1, 1993
3.068
+0.894
41.13%
jan 1, 1994
2.808
-0.26
-8.47%
jan 1, 1995
2.409
-0.399
-14.2%
jan 1, 1996
2.516
+0.107
4.44%
jan 1, 1997
2.924
+0.408
16.21%
jan 1, 1998
2.564
-0.36
-12.33%
jan 1, 1999
2.079
-0.485
-18.9%
jan 1, 2000
1.699
-0.38
-18.28%
jan 1, 2001
3.325
+1.625
95.66%
jan 1, 2002
3.501
+0.176
5.3%
jan 1, 2003
4.864
+1.363
38.93%
jan 1, 2004
3.277
-1.587
-32.62%
jan 1, 2005
3.134
-0.143
-4.36%
jan 1, 2006
4.019
+0.885
28.25%
jan 1, 2007
5.017
+0.998
24.82%
jan 1, 2008
5.664
+0.647
12.9%
jan 1, 2009
5.538
-0.126
-2.23%
jan 1, 2010
5.549
+0.011
0.19%
jan 1, 2011
6.531
+0.983
17.71%
jan 1, 2012
6.404
-0.128
-1.96%
jan 1, 2013
5.247
-1.157
-18.07%
jan 1, 2014
5.729
+0.483
9.2%
jan 1, 2015
5.061
-0.669
-11.67%
jan 1, 2016
4.707
-0.354
-7.0%
Ranking of countries by current statistics by years


Comments: