29
/
en
AIzaSyAYiBZKx7MnpbEhh9jyipgxe19OcubqV5w
April 1, 2024
62420
World
WLD
false
2
1
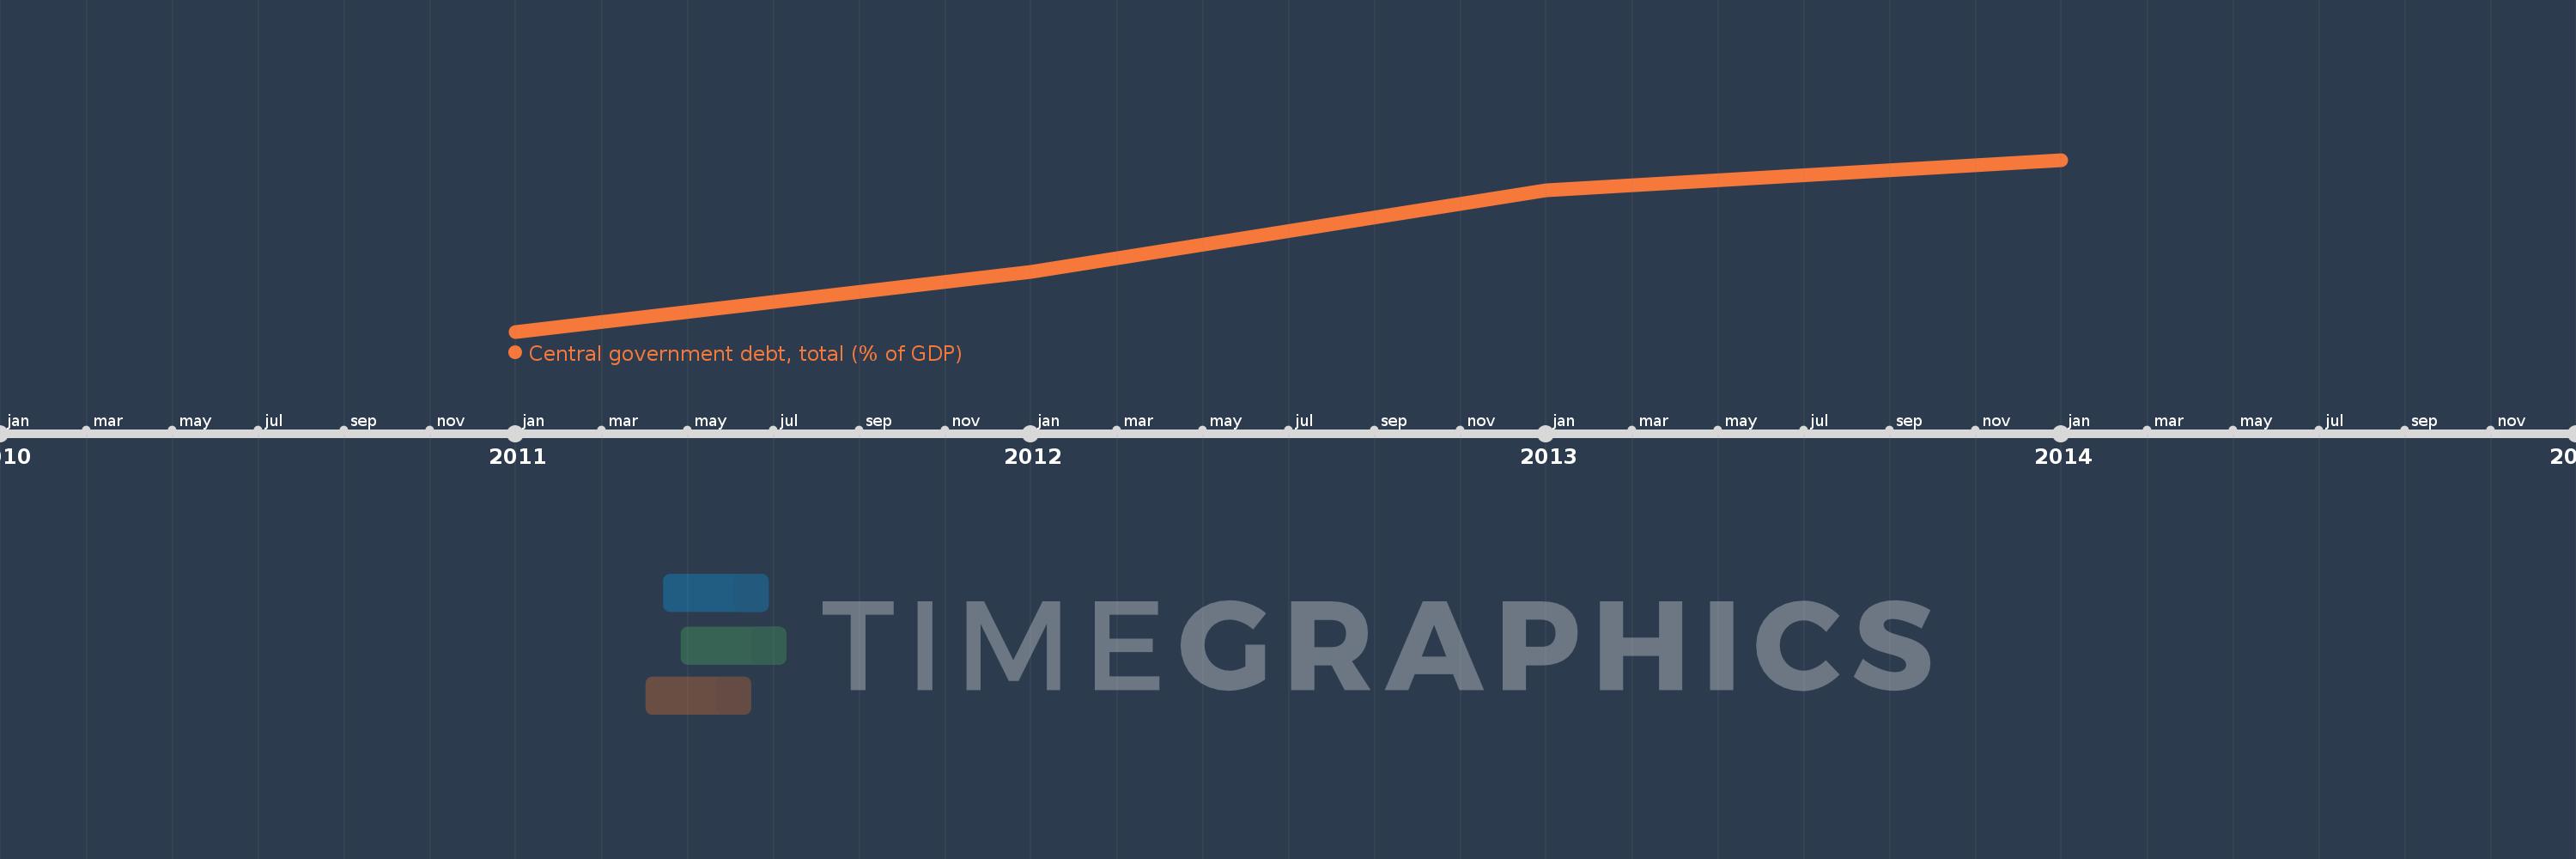
Central government debt, total (% of GDP)
2014,2013,2012,2011
This statistics in other country:
Timeline:
This timeline shows a graph from 2011 to 2014 of World. No data until 2010. Number of actual observations by date: 4.
Source name:
World Development Indicators
Source organization:
International Monetary Fund, Government Finance Statistics Yearbook and data files, and World Bank and OECD GDP estimates.
Categories, topics:
Economy & Growth, Public Sector
Last updated:
apr 23, 2017
Indicators value changes by year
Minimum:
78.753
jan 1, 2011
Maximum:
89.533
jan 1, 2014
At the date of observation
Value
Absolute change
Change from previous value
jan 1, 2011
78.753
+78.753
0.0%
jan 1, 2012
82.525
+3.772
4.79%
jan 1, 2013
87.607
+5.082
6.16%
jan 1, 2014
89.533
+1.926
2.2%
Ranking of countries by current statistics by years


Comments: