29
/
en
AIzaSyAYiBZKx7MnpbEhh9jyipgxe19OcubqV5w
April 1, 2024
68628
Antigua and Barbuda
ATG
true
2
1
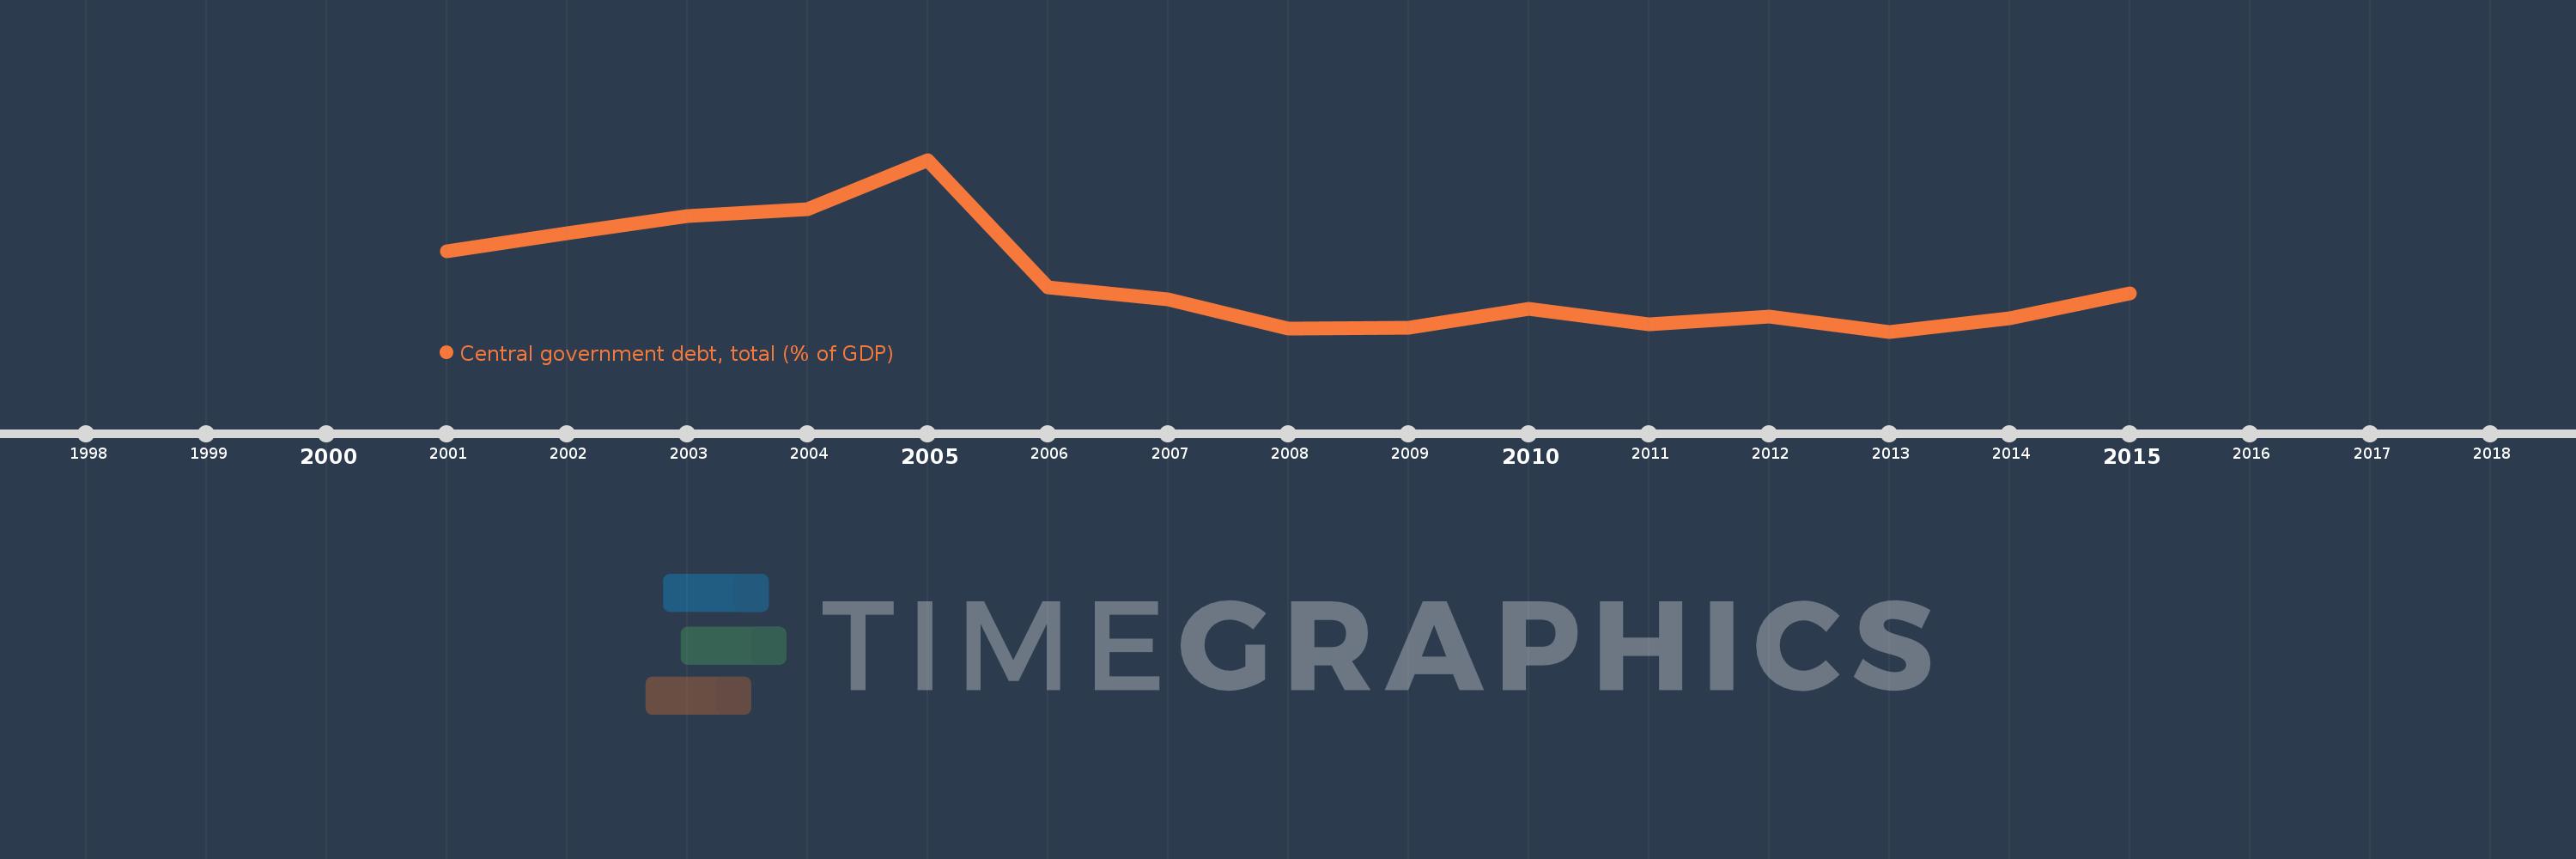
Central government debt, total (% of GDP)
2015,2014,2013,2012,2011,2010,2009,2008,2007,2006,2005,2004,2003,2002,2001
This statistics in other country:
Timeline:
This timeline shows a graph from 2001 to 2015 of Antigua and Barbuda. No data until 2000. Number of actual observations by date: 15.
Source name:
World Development Indicators
Source organization:
International Monetary Fund, Government Finance Statistics Yearbook and data files, and World Bank and OECD GDP estimates.
Categories, topics:
Economy & Growth, Public Sector
Last updated:
apr 23, 2017
Indicators value changes by year
Minimum:
72.481
jan 1, 2013
Maximum:
135.564
jan 1, 2005
At the date of observation
Value
Absolute change
Change from previous value
jan 1, 2001
101.901
+101.901
0.0%
jan 1, 2002
108.708
+6.807
6.68%
jan 1, 2003
115.058
+6.349
5.84%
jan 1, 2004
117.514
+2.456
2.13%
jan 1, 2005
135.564
+18.051
15.36%
jan 1, 2006
88.852
-46.713
-34.46%
jan 1, 2007
84.271
-4.581
-5.16%
jan 1, 2008
73.491
-10.78
-12.79%
jan 1, 2009
73.769
+0.278
0.38%
jan 1, 2010
80.817
+7.048
9.55%
jan 1, 2011
75.289
-5.528
-6.84%
jan 1, 2012
77.882
+2.593
3.44%
jan 1, 2013
72.481
-5.401
-6.93%
jan 1, 2014
77.426
+4.945
6.82%
jan 1, 2015
86.617
+9.191
11.87%
Ranking of countries by current statistics by years


Comments: