29
/
en
AIzaSyAYiBZKx7MnpbEhh9jyipgxe19OcubqV5w
April 1, 2024
52446
OECD members
OED
false
2
1
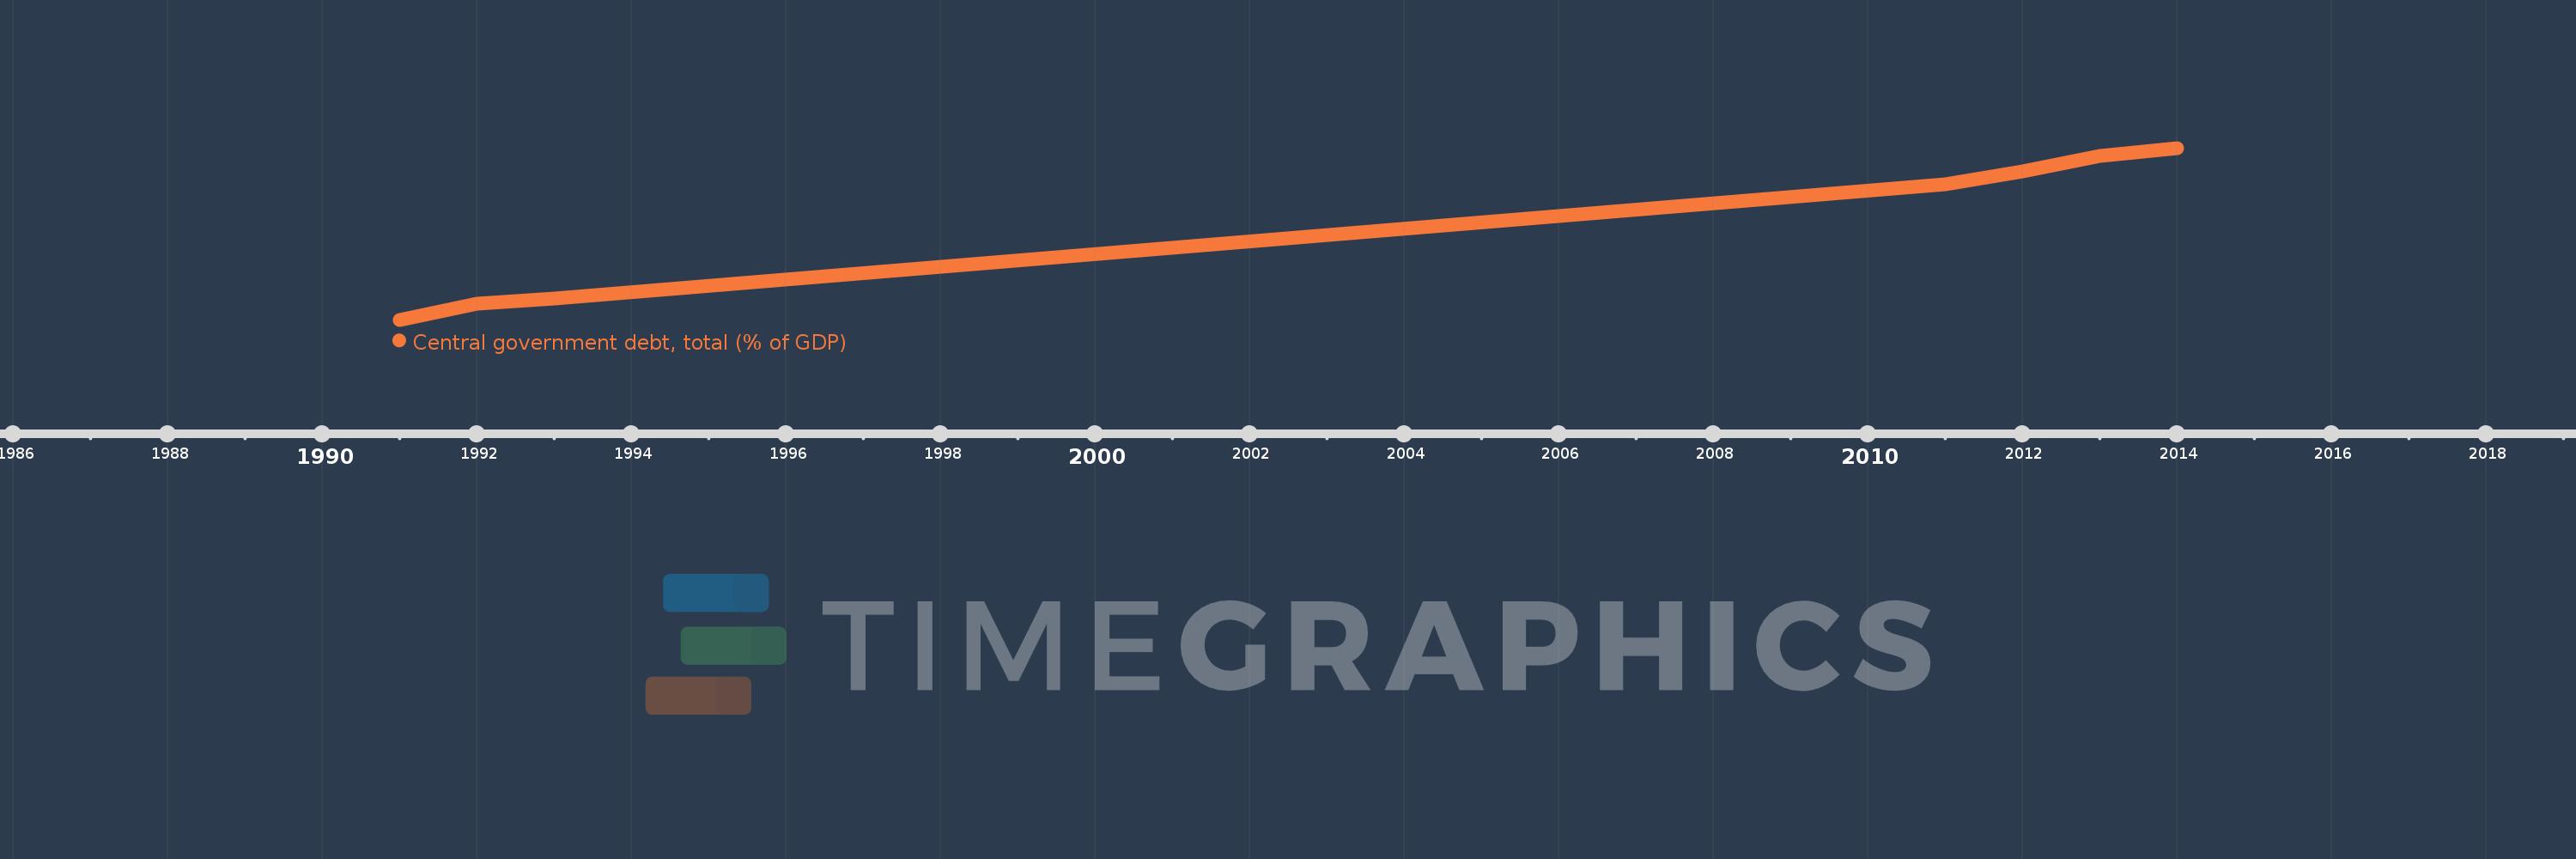
Central government debt, total (% of GDP)
2014,2013,2012,2011,1993,1992,1991
This statistics in other country:
Timeline:
This timeline shows a graph from 1991 to 2014 of OECD members. No data until 1990. Number of actual observations by date: 7.
Source name:
World Development Indicators
Source organization:
International Monetary Fund, Government Finance Statistics Yearbook and data files, and World Bank and OECD GDP estimates.
Categories, topics:
Economy & Growth, Public Sector
Last updated:
apr 23, 2017
Indicators value changes by year
Minimum:
36.178
jan 1, 1991
Maximum:
99.284
jan 1, 2014
At the date of observation
Value
Absolute change
Change from previous value
jan 1, 1991
36.178
+36.178
0.0%
jan 1, 1992
42.168
+5.99
16.56%
jan 1, 1993
44.061
+1.893
4.49%
jan 1, 2011
86.0
+41.939
95.18%
jan 1, 2012
90.543
+4.543
5.28%
jan 1, 2013
96.323
+5.78
6.38%
jan 1, 2014
99.284
+2.962
3.07%
Ranking of countries by current statistics by years


Comments: