29
/
en
AIzaSyAYiBZKx7MnpbEhh9jyipgxe19OcubqV5w
April 1, 2024
117673
Czech Republic
CZE
true
2
1
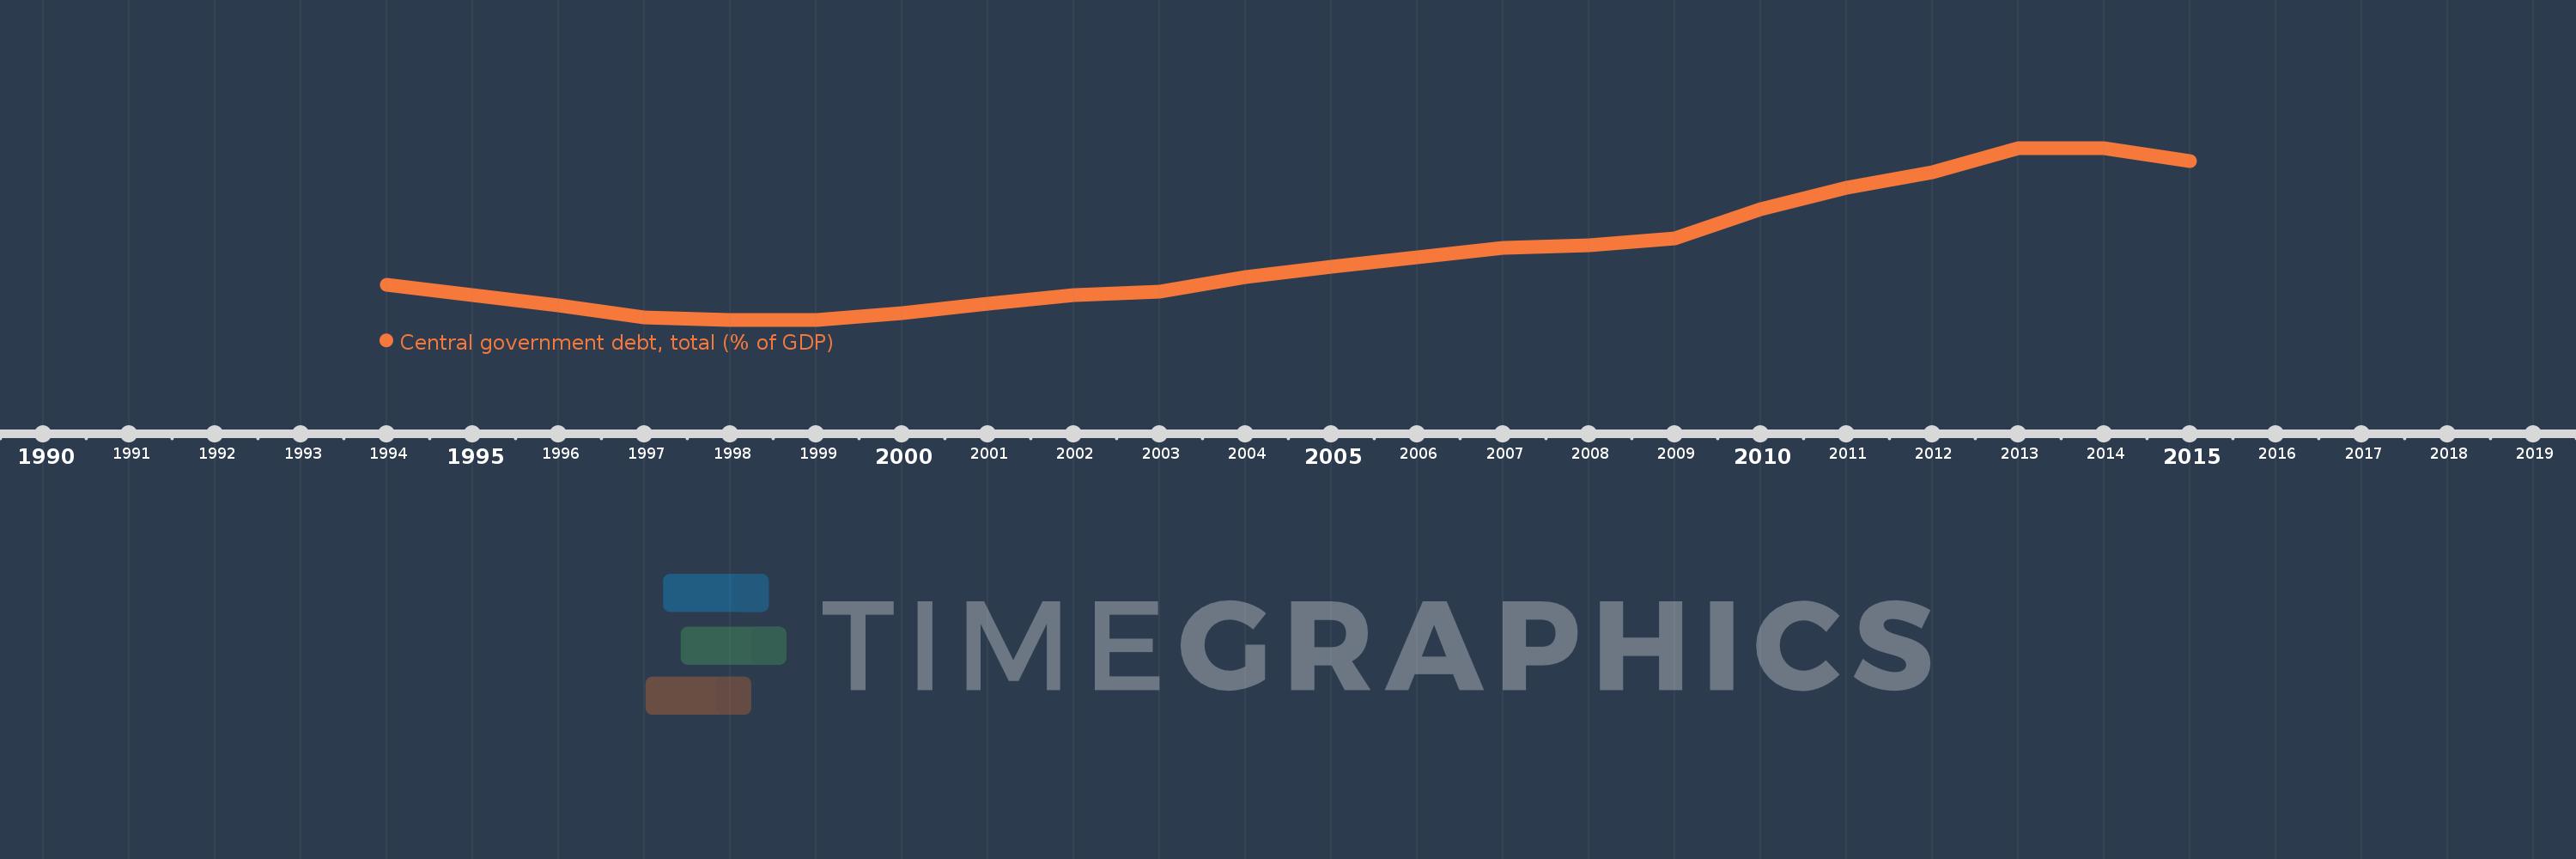
Central government debt, total (% of GDP)
2015,2014,2013,2012,2011,2010,2009,2008,2007,2006,2005,2004,2003,2002,2001,2000,1999,1998,1997,1996,1995,1994
This statistics in other country:
Timeline:
This timeline shows a graph from 1994 to 2015 of Czech Republic. No data until 1993. Number of actual observations by date: 22.
Source name:
World Development Indicators
Source organization:
International Monetary Fund, Government Finance Statistics Yearbook and data files, and World Bank and OECD GDP estimates.
Categories, topics:
Economy & Growth, Public Sector
Last updated:
apr 23, 2017
Indicators value changes by year
At the date of observation
Value
Absolute change
Change from previous value
jan 1, 1994
16.003
+16.003
0.0%
jan 1, 1995
14.241
-1.762
-11.01%
jan 1, 1996
12.334
-1.906
-13.39%
jan 1, 1997
10.224
-2.11
-17.11%
jan 1, 1998
9.798
-0.426
-4.17%
jan 1, 1999
9.794
-0.004
-0.04%
jan 1, 2000
10.909
+1.115
11.38%
jan 1, 2001
12.645
+1.737
15.92%
jan 1, 2002
14.212
+1.567
12.39%
jan 1, 2003
14.808
+0.596
4.19%
jan 1, 2004
17.53
+2.723
18.39%
jan 1, 2005
19.263
+1.733
9.89%
jan 1, 2006
21.074
+1.81
9.4%
jan 1, 2007
22.663
+1.59
7.54%
jan 1, 2008
23.125
+0.461
2.04%
jan 1, 2009
24.416
+1.291
5.58%
jan 1, 2010
29.59
+5.174
21.19%
jan 1, 2011
33.556
+3.967
13.41%
jan 1, 2012
36.259
+2.702
8.05%
jan 1, 2013
40.64
+4.381
12.08%
jan 1, 2014
40.613
-0.027
-0.07%
jan 1, 2015
38.21
-2.403
-5.92%
Ranking of countries by current statistics by years


Comments: