29
/
en
AIzaSyAYiBZKx7MnpbEhh9jyipgxe19OcubqV5w
April 1, 2024
214086
Norway
NOR
true
2
1
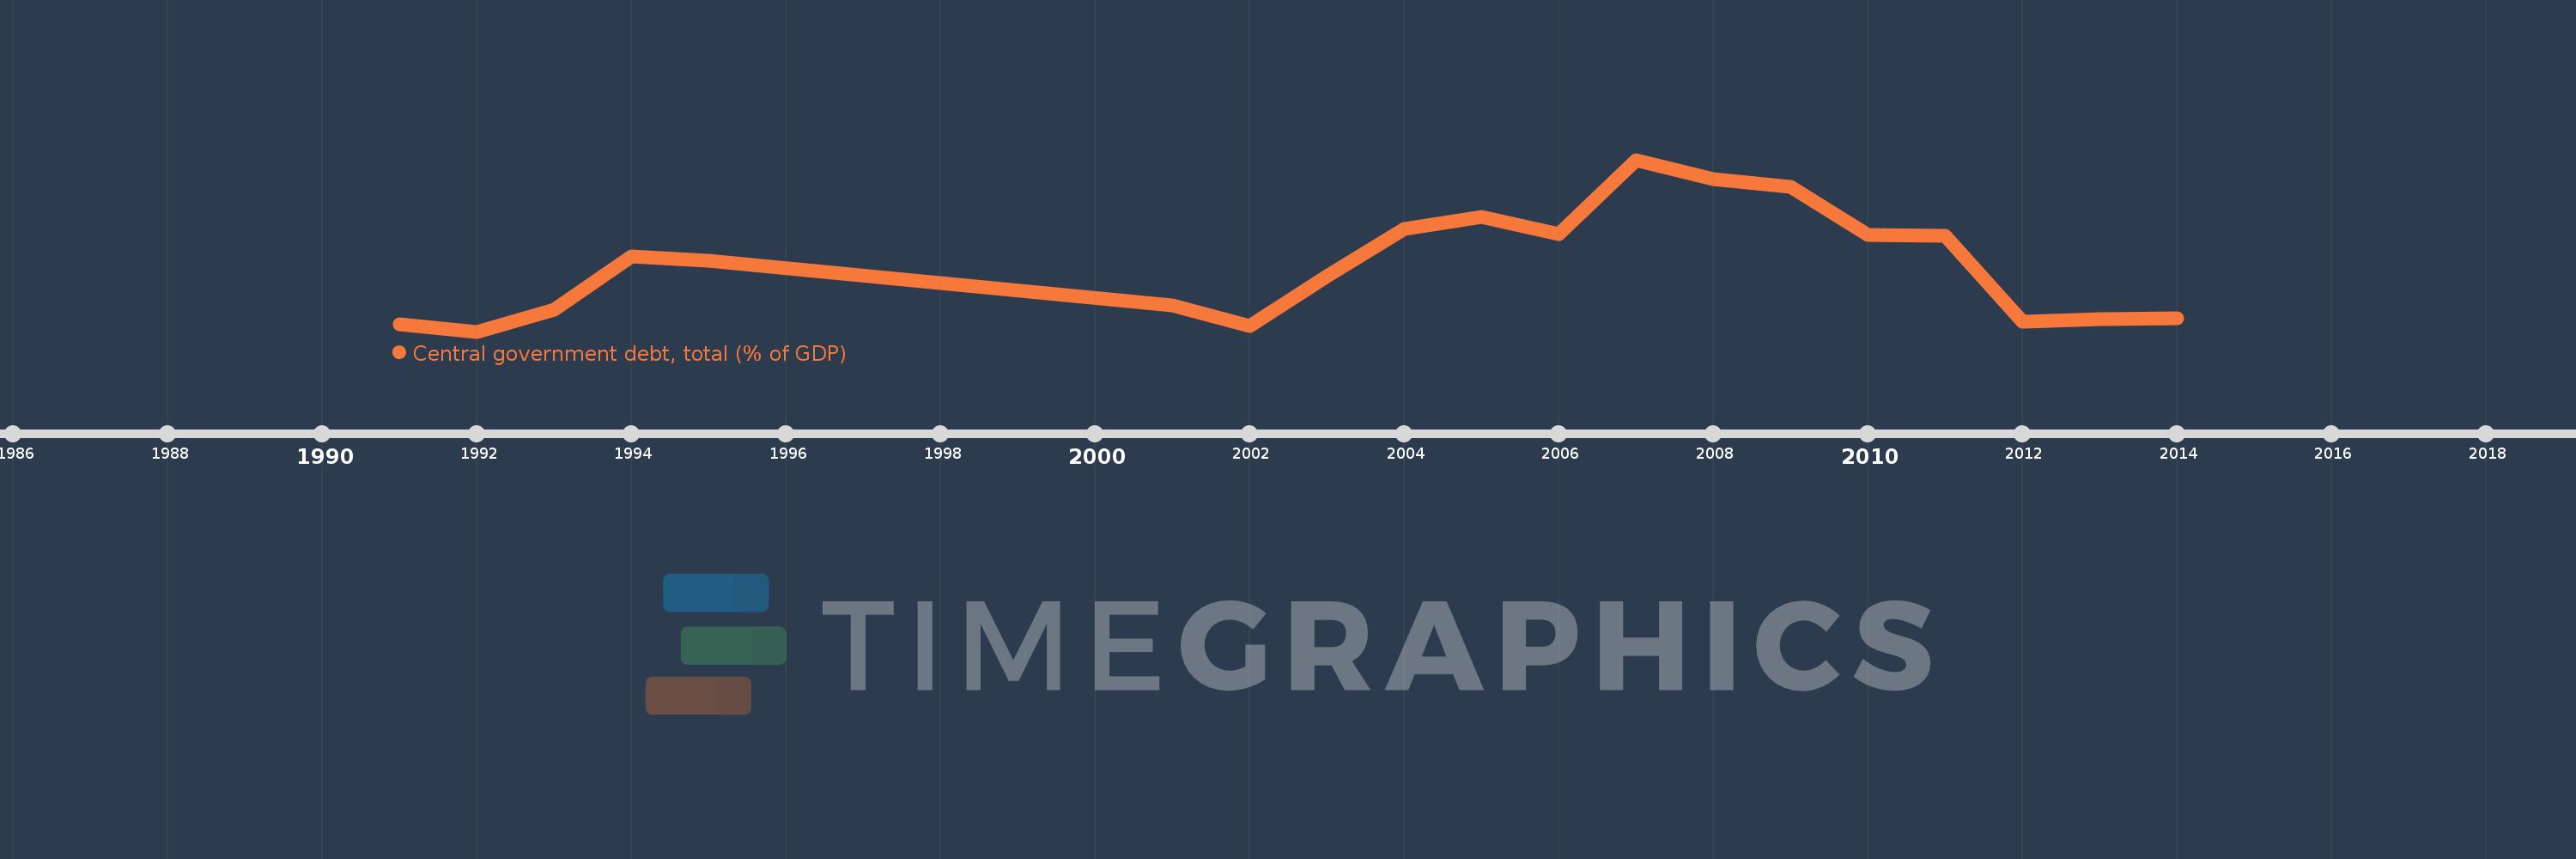
Central government debt, total (% of GDP)
2014,2013,2012,2011,2010,2009,2008,2007,2006,2005,2004,2003,2002,2001,1995,1994,1993,1992,1991
This statistics in other country:
Timeline:
This timeline shows a graph from 1991 to 2014 of Norway. No data until 1990. Number of actual observations by date: 19.
Source name:
World Development Indicators
Source organization:
International Monetary Fund, Government Finance Statistics Yearbook and data files, and World Bank and OECD GDP estimates.
Categories, topics:
Economy & Growth, Public Sector
Last updated:
apr 23, 2017
Indicators value changes by year
Minimum:
18.594
jan 1, 1992
Maximum:
48.188
jan 1, 2007
At the date of observation
Value
Absolute change
Change from previous value
jan 1, 1991
19.847
+19.847
0.0%
jan 1, 1992
18.594
-1.253
-6.31%
jan 1, 1993
22.343
+3.749
20.16%
jan 1, 1994
31.561
+9.218
41.26%
jan 1, 1995
30.752
-0.809
-2.56%
jan 1, 2001
23.056
-7.696
-25.03%
jan 1, 2002
19.572
-3.484
-15.11%
jan 1, 2003
28.079
+8.507
43.47%
jan 1, 2004
36.272
+8.193
29.18%
jan 1, 2005
38.319
+2.047
5.64%
jan 1, 2006
35.371
-2.948
-7.69%
jan 1, 2007
48.188
+12.817
36.24%
jan 1, 2008
44.88
-3.308
-6.87%
jan 1, 2009
43.516
-1.364
-3.04%
jan 1, 2010
35.269
-8.247
-18.95%
jan 1, 2011
35.138
-0.131
-0.37%
jan 1, 2012
20.28
-14.858
-42.29%
jan 1, 2013
20.775
+0.495
2.44%
jan 1, 2014
20.937
+0.162
0.78%
Ranking of countries by current statistics by years


Comments: