29
/
en
AIzaSyAYiBZKx7MnpbEhh9jyipgxe19OcubqV5w
April 1, 2024
215055
Oman
OMN
true
2
1
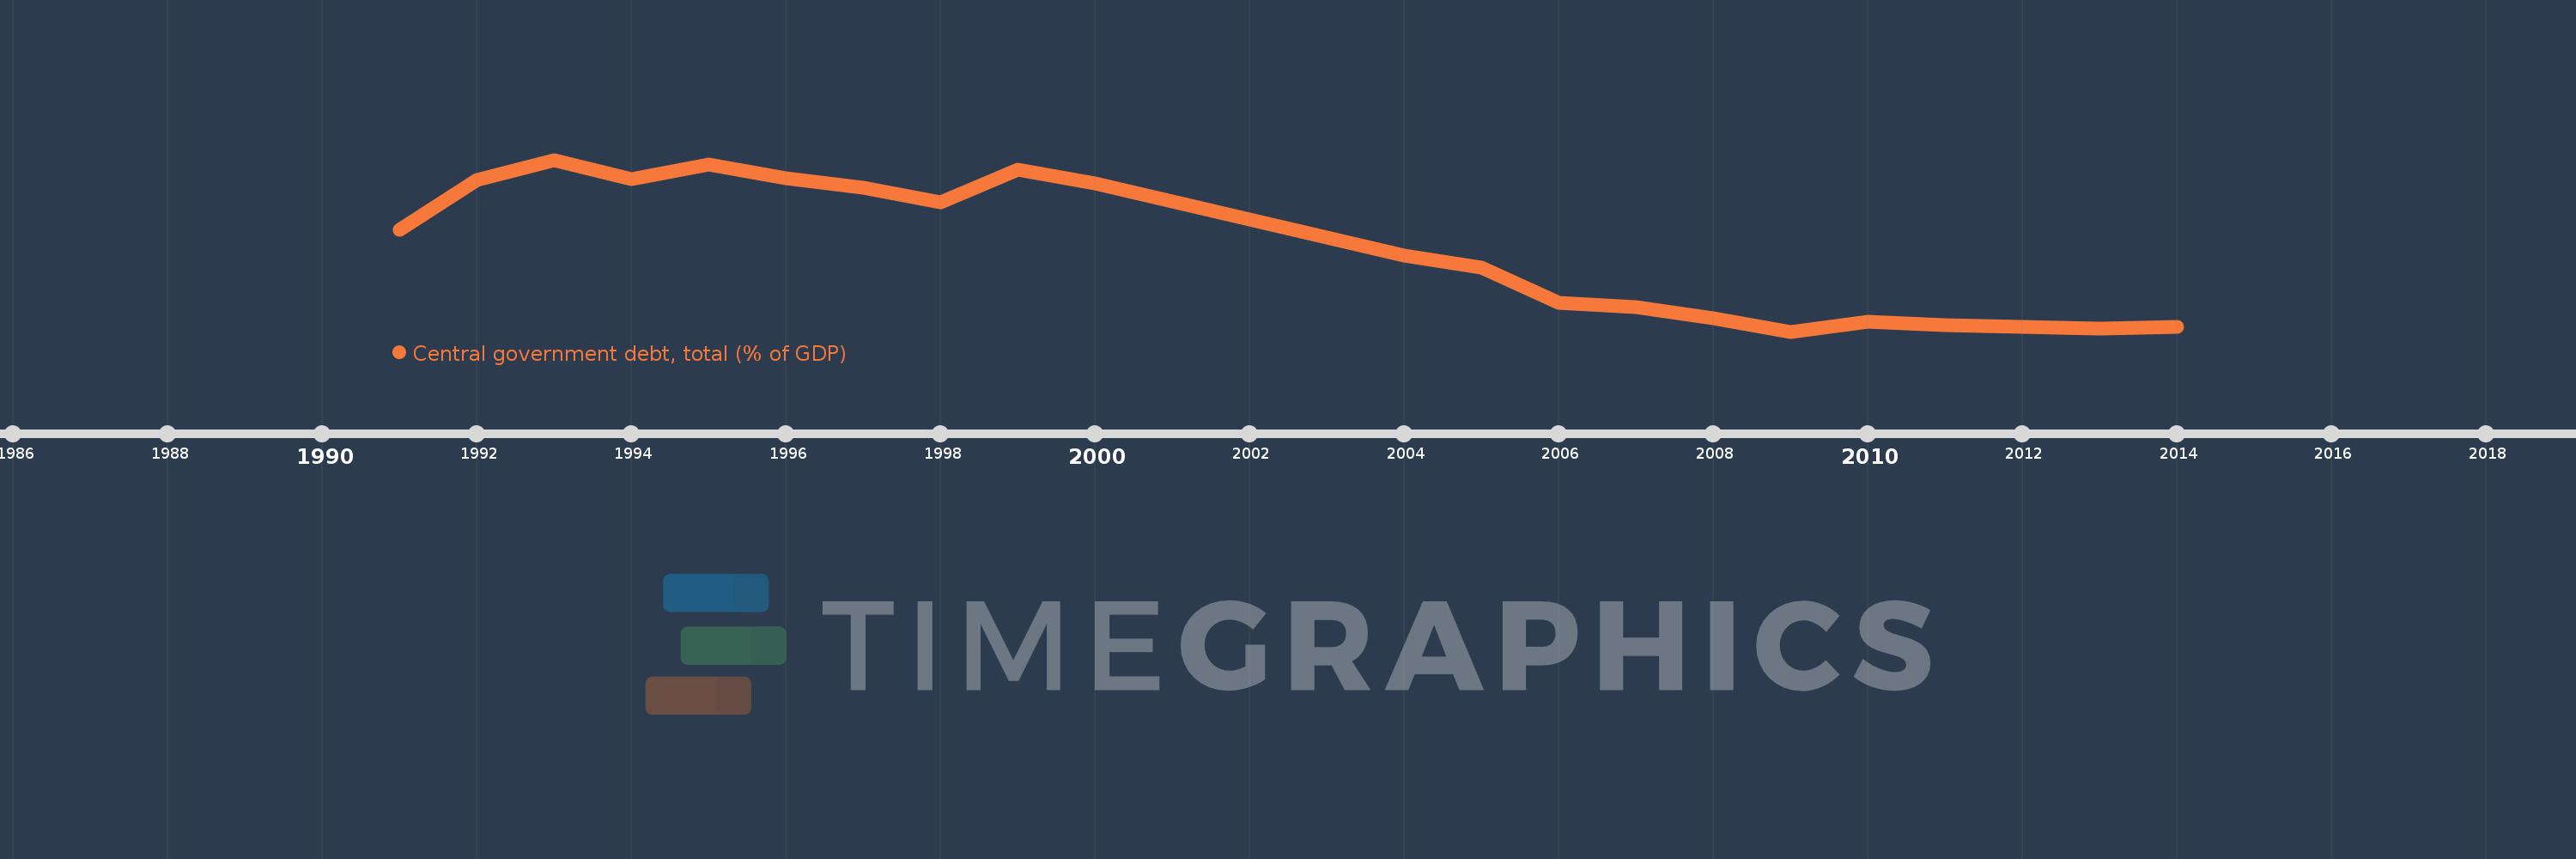
Central government debt, total (% of GDP)
2014,2013,2012,2011,2010,2009,2008,2007,2006,2005,2004,2000,1999,1998,1997,1996,1995,1994,1993,1992,1991
This statistics in other country:
Timeline:
This timeline shows a graph from 1991 to 2014 of Oman. No data until 1990. Number of actual observations by date: 21.
Source name:
World Development Indicators
Source organization:
International Monetary Fund, Government Finance Statistics Yearbook and data files, and World Bank and OECD GDP estimates.
Categories, topics:
Economy & Growth, Public Sector
Last updated:
apr 23, 2017
Indicators value changes by year
Maximum:
30.212
jan 1, 1993
At the date of observation
Value
Absolute change
Change from previous value
jan 1, 1991
19.58
+19.58
0.0%
jan 1, 1992
27.174
+7.594
38.79%
jan 1, 1993
30.212
+3.038
11.18%
jan 1, 1994
27.309
-2.903
-9.61%
jan 1, 1995
29.447
+2.138
7.83%
jan 1, 1996
27.41
-2.036
-6.91%
jan 1, 1997
25.983
-1.428
-5.21%
jan 1, 1998
23.756
-2.227
-8.57%
jan 1, 1999
28.751
+4.995
21.03%
jan 1, 2000
26.678
-2.073
-7.21%
jan 1, 2004
15.687
-10.991
-41.2%
jan 1, 2005
13.854
-1.834
-11.69%
jan 1, 2006
8.518
-5.336
-38.51%
jan 1, 2007
7.88
-0.638
-7.49%
jan 1, 2008
6.185
-1.695
-21.51%
jan 1, 2009
4.12
-2.065
-33.39%
jan 1, 2010
5.616
+1.496
36.3%
jan 1, 2011
5.039
-0.576
-10.27%
jan 1, 2012
4.775
-0.265
-5.25%
jan 1, 2013
4.614
-0.161
-3.36%
jan 1, 2014
4.898
+0.284
6.15%
Ranking of countries by current statistics by years


Comments: