29
/
en
AIzaSyAYiBZKx7MnpbEhh9jyipgxe19OcubqV5w
April 1, 2024
132929
Finland
FIN
true
2
1
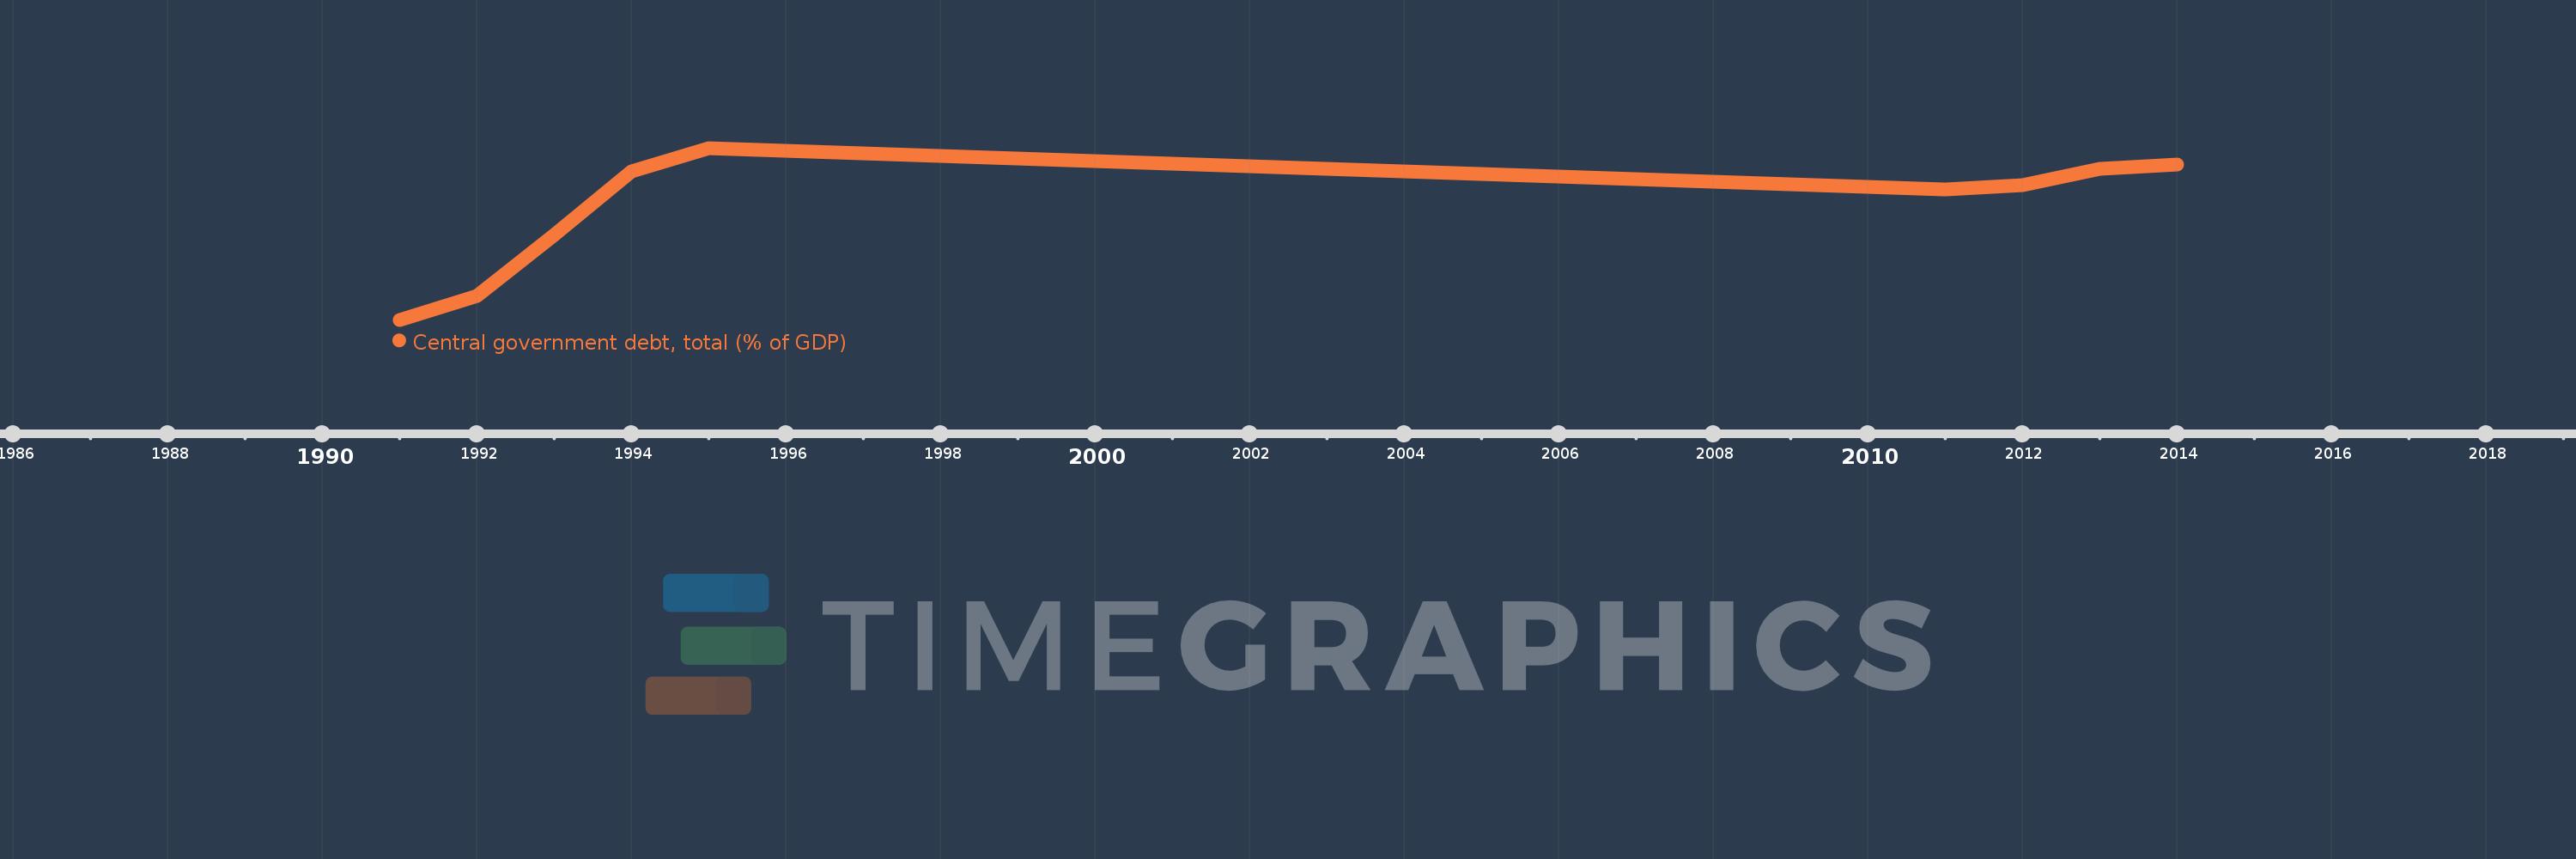
Central government debt, total (% of GDP)
2014,2013,2012,2011,1995,1994,1993,1992,1991
This statistics in other country:
Timeline:
This timeline shows a graph from 1991 to 2014 of Finland. No data until 1990. Number of actual observations by date: 9.
Source name:
World Development Indicators
Source organization:
International Monetary Fund, Government Finance Statistics Yearbook and data files, and World Bank and OECD GDP estimates.
Categories, topics:
Economy & Growth, Public Sector
Last updated:
apr 23, 2017
Indicators value changes by year
Maximum:
58.235
jan 1, 1995
At the date of observation
Value
Absolute change
Change from previous value
jan 1, 1991
10.47
+10.47
0.0%
jan 1, 1992
17.003
+6.533
62.4%
jan 1, 1993
34.079
+17.076
100.43%
jan 1, 1994
51.601
+17.522
51.42%
jan 1, 1995
58.235
+6.635
12.86%
jan 1, 2011
46.811
-11.424
-19.62%
jan 1, 2012
47.891
+1.08
2.31%
jan 1, 2013
52.465
+4.574
9.55%
jan 1, 2014
53.531
+1.066
2.03%
Ranking of countries by current statistics by years


Comments: