29
/
en
AIzaSyAYiBZKx7MnpbEhh9jyipgxe19OcubqV5w
April 1, 2024
188765
Maldives
MDV
true
2
1
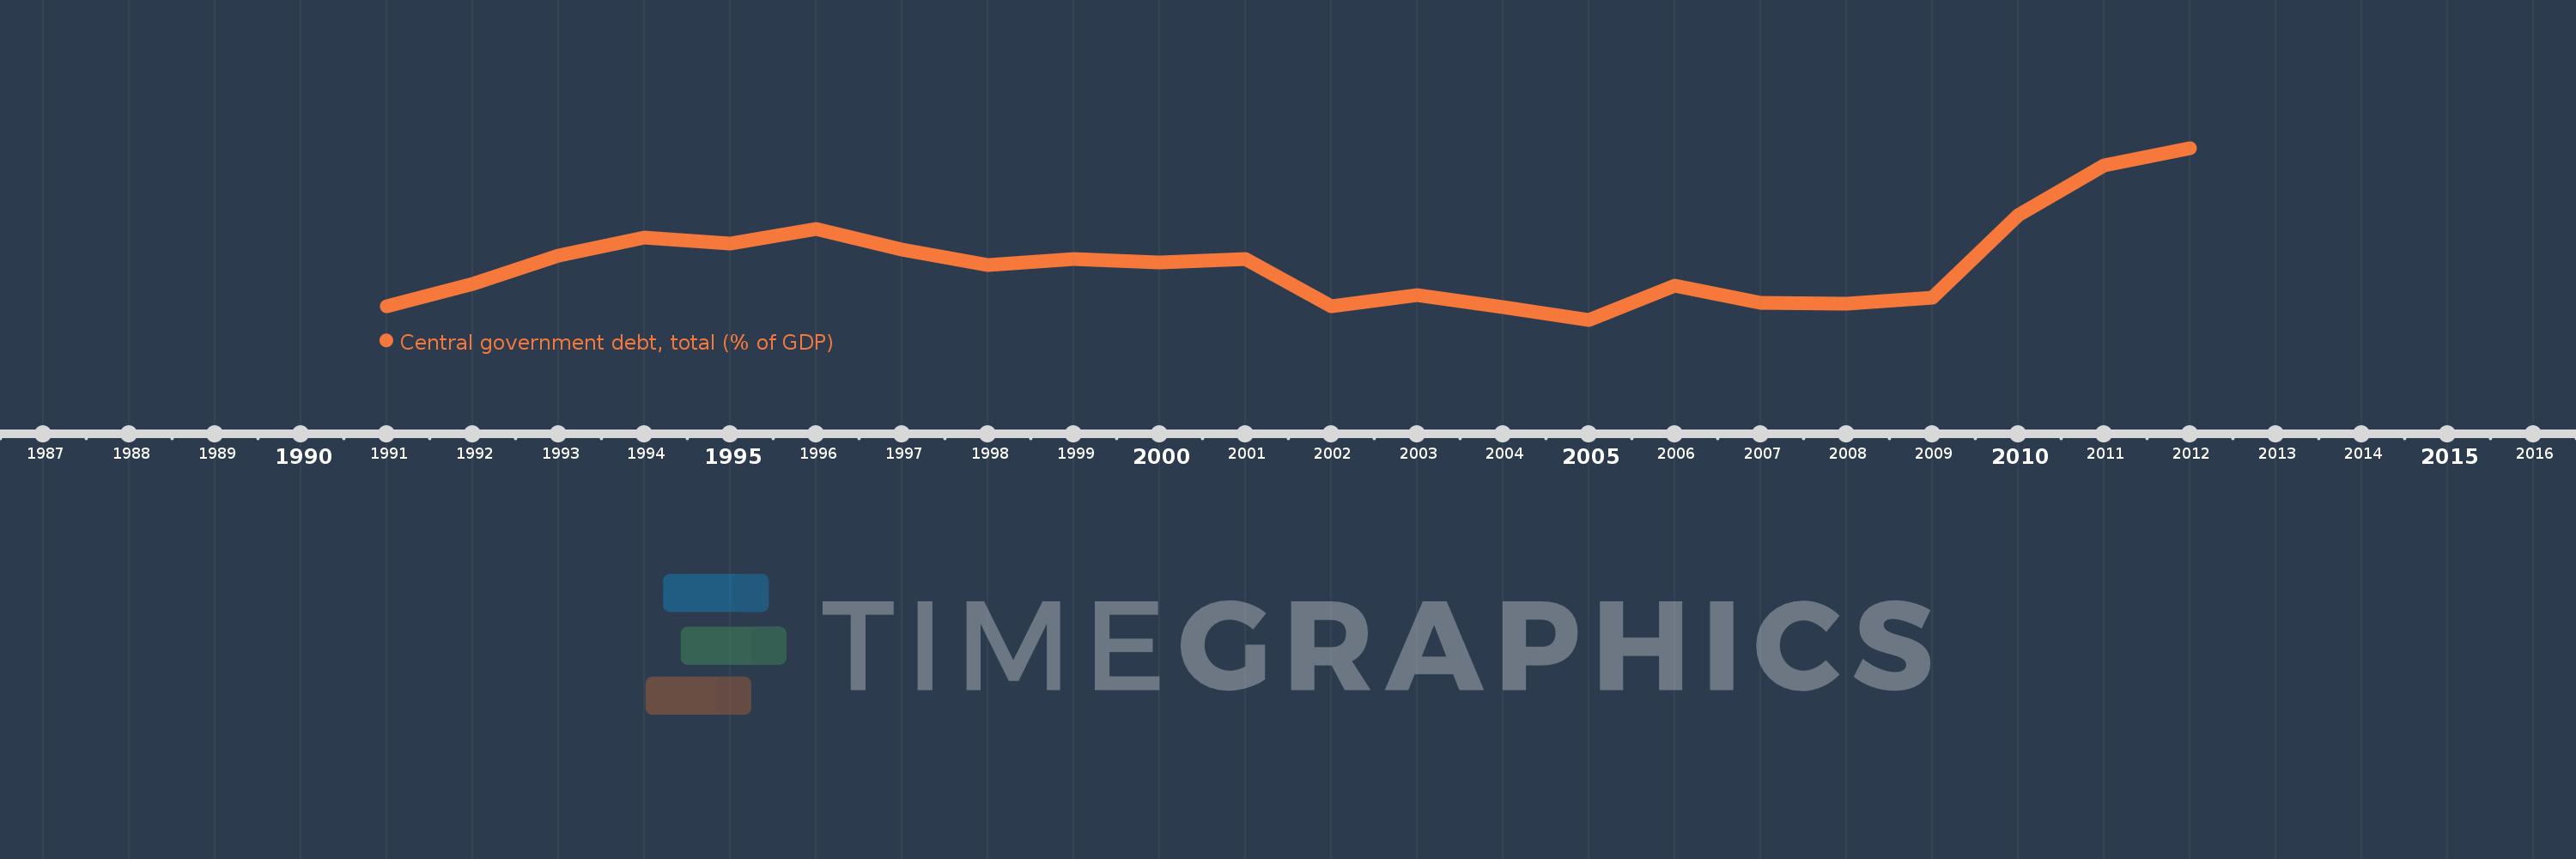
Central government debt, total (% of GDP)
2012,2011,2010,2009,2008,2007,2006,2005,2004,2003,2002,2001,2000,1999,1998,1997,1996,1995,1994,1993,1992,1991
This statistics in other country:
Timeline:
This timeline shows a graph from 1991 to 2012 of Maldives. No data until 1990. Number of actual observations by date: 22.
Source name:
World Development Indicators
Source organization:
International Monetary Fund, Government Finance Statistics Yearbook and data files, and World Bank and OECD GDP estimates.
Categories, topics:
Economy & Growth, Public Sector
Last updated:
apr 23, 2017
Indicators value changes by year
Minimum:
27.831
jan 1, 2005
Maximum:
64.895
jan 1, 2012
At the date of observation
Value
Absolute change
Change from previous value
jan 1, 1991
30.782
+30.782
0.0%
jan 1, 1992
35.573
+4.791
15.56%
jan 1, 1993
41.615
+6.042
16.98%
jan 1, 1994
45.552
+3.936
9.46%
jan 1, 1995
44.212
-1.34
-2.94%
jan 1, 1996
47.352
+3.14
7.1%
jan 1, 1997
43.035
-4.317
-9.12%
jan 1, 1998
39.67
-3.365
-7.82%
jan 1, 1999
40.987
+1.316
3.32%
jan 1, 2000
40.126
-0.86
-2.1%
jan 1, 2001
40.864
+0.738
1.84%
jan 1, 2002
30.733
-10.131
-24.79%
jan 1, 2003
33.081
+2.348
7.64%
jan 1, 2004
30.606
-2.475
-7.48%
jan 1, 2005
27.831
-2.775
-9.07%
jan 1, 2006
35.247
+7.416
26.65%
jan 1, 2007
31.554
-3.693
-10.48%
jan 1, 2008
31.23
-0.324
-1.03%
jan 1, 2009
32.668
+1.438
4.61%
jan 1, 2010
50.407
+17.739
54.3%
jan 1, 2011
61.14
+10.733
21.29%
jan 1, 2012
64.895
+3.755
6.14%
Ranking of countries by current statistics by years


Comments: