29
/
en
AIzaSyAYiBZKx7MnpbEhh9jyipgxe19OcubqV5w
April 1, 2024
223247
Philippines
PHL
true
2
1
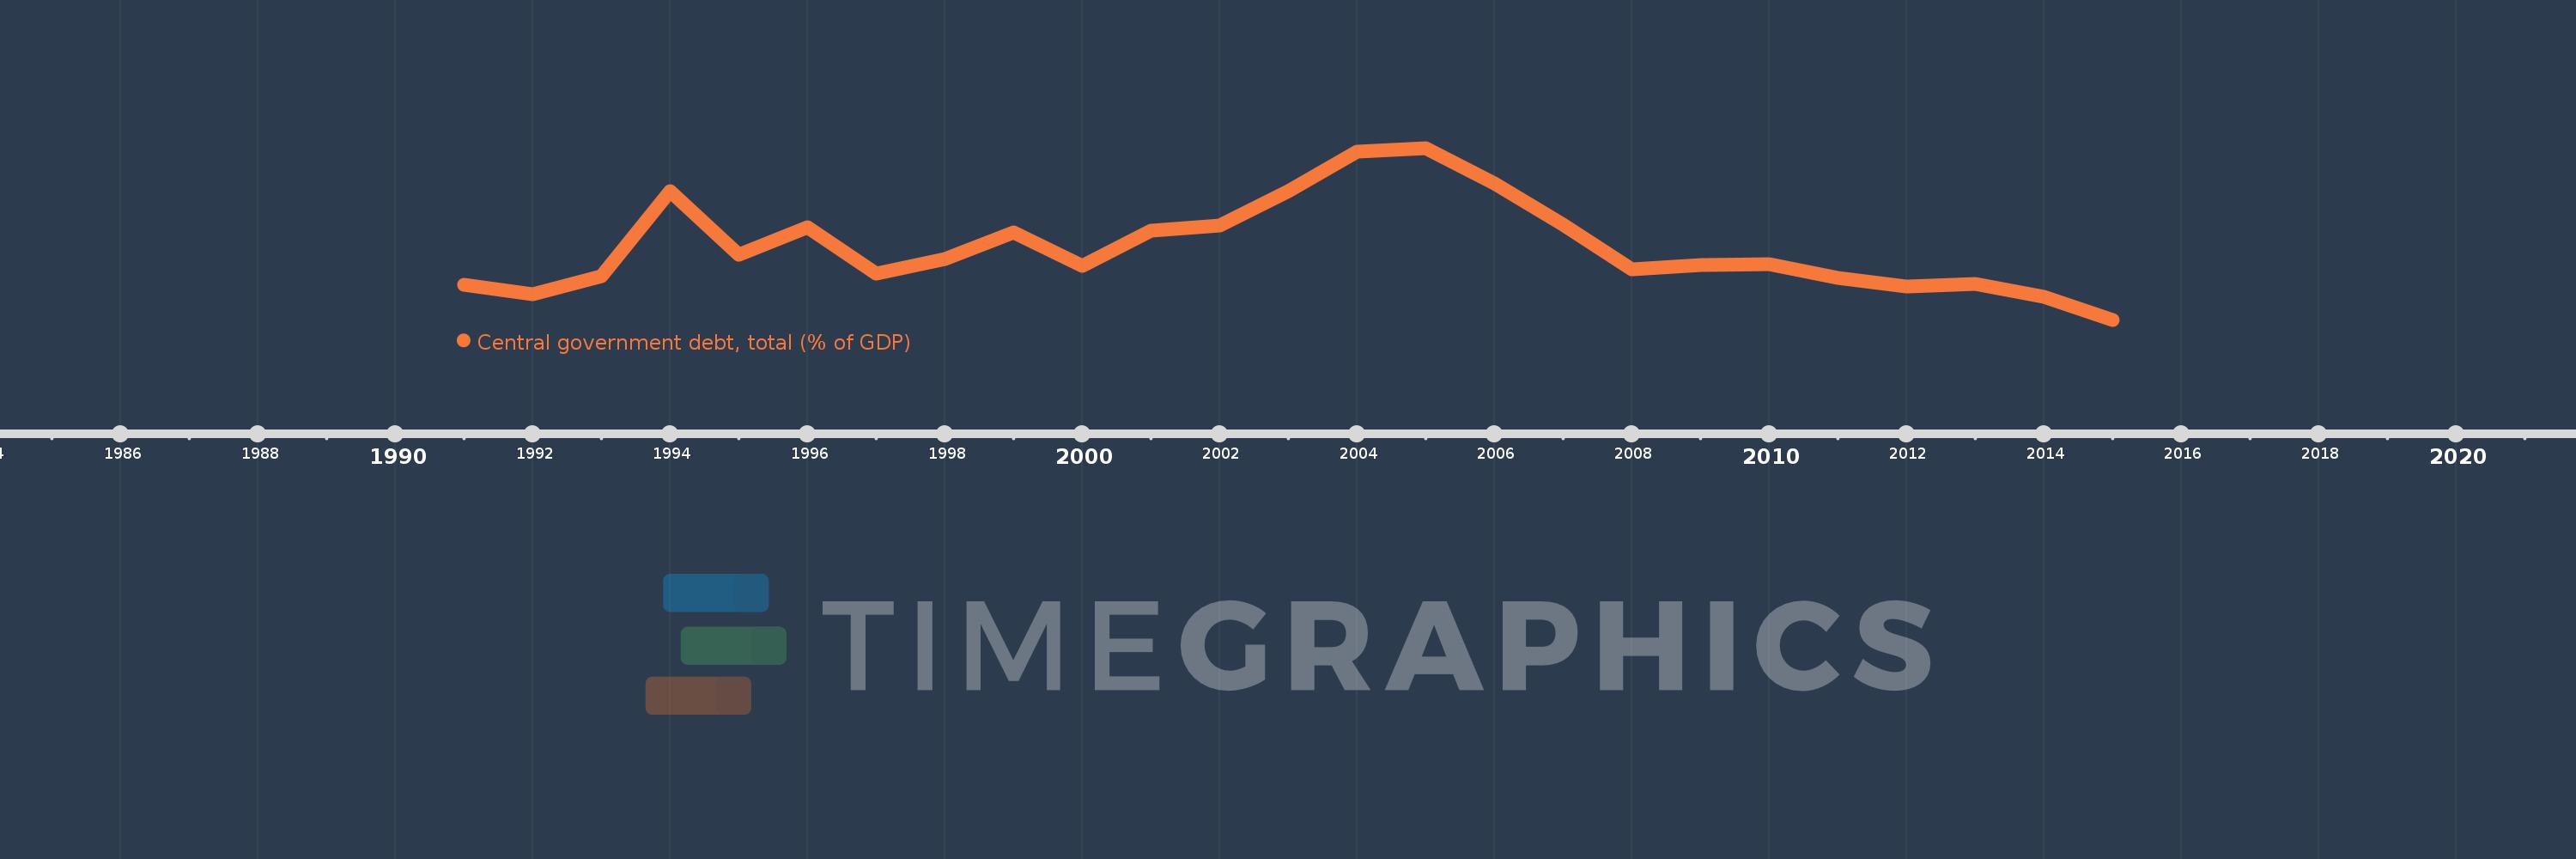
Central government debt, total (% of GDP)
2015,2014,2013,2012,2011,2010,2009,2008,2007,2006,2005,2004,2003,2002,2001,2000,1999,1998,1997,1996,1995,1994,1993,1992,1991
This statistics in other country:
Timeline:
This timeline shows a graph from 1991 to 2015 of Philippines. No data until 1990. Number of actual observations by date: 25.
Source name:
World Development Indicators
Source organization:
International Monetary Fund, Government Finance Statistics Yearbook and data files, and World Bank and OECD GDP estimates.
Categories, topics:
Economy & Growth, Public Sector
Last updated:
apr 23, 2017
Indicators value changes by year
Minimum:
45.355
jan 1, 2015
Maximum:
74.446
jan 1, 2005
At the date of observation
Value
Absolute change
Change from previous value
jan 1, 1991
51.302
+51.302
0.0%
jan 1, 1992
49.698
-1.604
-3.13%
jan 1, 1993
52.773
+3.075
6.19%
jan 1, 1994
67.131
+14.358
27.21%
jan 1, 1995
56.417
-10.715
-15.96%
jan 1, 1996
61.064
+4.647
8.24%
jan 1, 1997
53.19
-7.874
-12.89%
jan 1, 1998
55.654
+2.464
4.63%
jan 1, 1999
60.125
+4.471
8.03%
jan 1, 2000
54.519
-5.607
-9.32%
jan 1, 2001
60.511
+5.992
10.99%
jan 1, 2002
61.328
+0.817
1.35%
jan 1, 2003
67.061
+5.734
9.35%
jan 1, 2004
73.769
+6.708
10.0%
jan 1, 2005
74.446
+0.676
0.92%
jan 1, 2006
68.482
-5.964
-8.01%
jan 1, 2007
61.416
-7.066
-10.32%
jan 1, 2008
53.861
-7.555
-12.3%
jan 1, 2009
54.669
+0.808
1.5%
jan 1, 2010
54.779
+0.11
0.2%
jan 1, 2011
52.404
-2.375
-4.34%
jan 1, 2012
50.999
-1.404
-2.68%
jan 1, 2013
51.482
+0.483
0.95%
jan 1, 2014
49.237
-2.246
-4.36%
jan 1, 2015
45.355
-3.882
-7.88%
Ranking of countries by current statistics by years


Comments: