29
/
en
AIzaSyAYiBZKx7MnpbEhh9jyipgxe19OcubqV5w
April 1, 2024
164537
Jordan
JOR
true
2
1
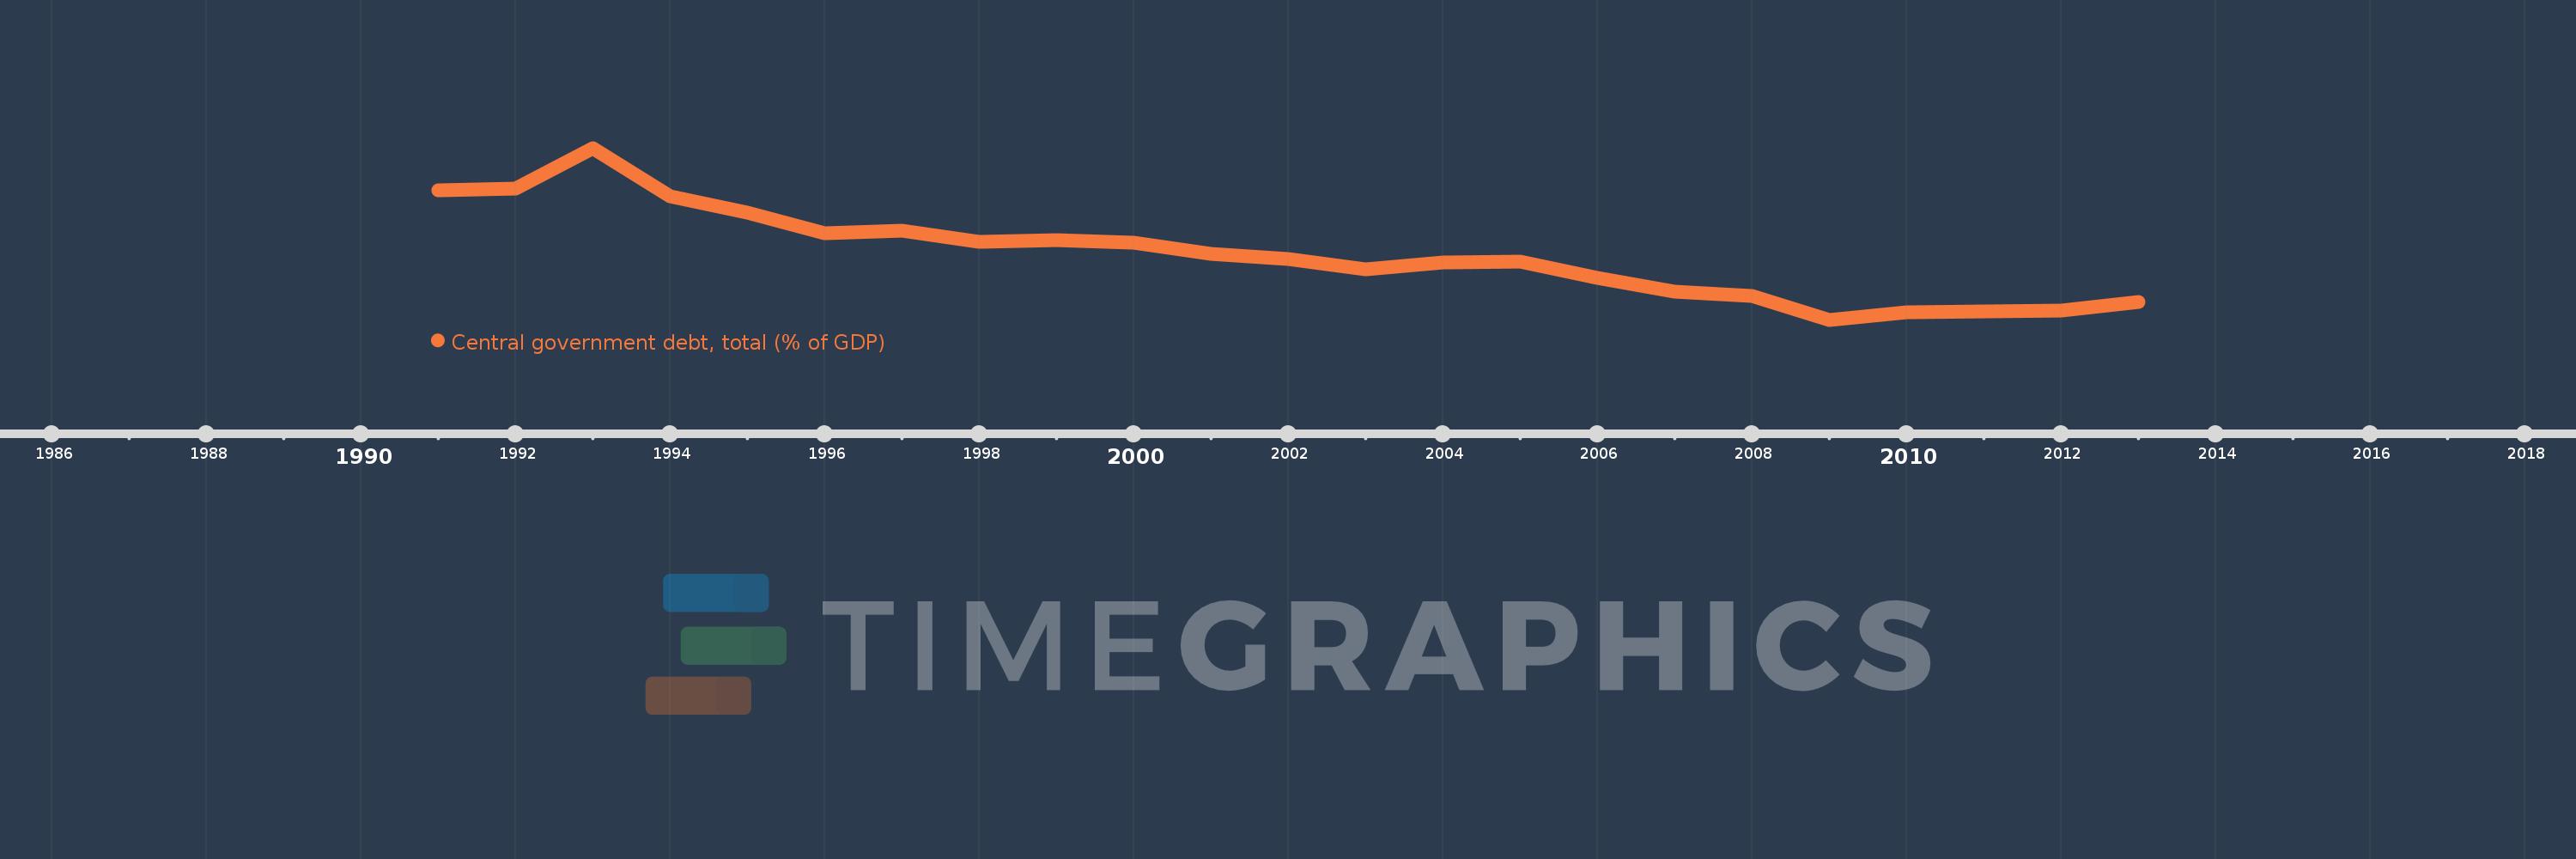
Central government debt, total (% of GDP)
2013,2012,2011,2010,2009,2008,2007,2006,2005,2004,2003,2002,2001,2000,1999,1998,1997,1996,1995,1994,1993,1992,1991
This statistics in other country:
Timeline:
This timeline shows a graph from 1991 to 2013 of Jordan. No data until 1990. Number of actual observations by date: 23.
Source name:
World Development Indicators
Source organization:
International Monetary Fund, Government Finance Statistics Yearbook and data files, and World Bank and OECD GDP estimates.
Categories, topics:
Economy & Growth, Public Sector
Last updated:
apr 23, 2017
Indicators value changes by year
Minimum:
56.785
jan 1, 2009
Maximum:
152.591
jan 1, 1993
At the date of observation
Value
Absolute change
Change from previous value
jan 1, 1991
128.8
+128.8
0.0%
jan 1, 1992
130.0
+1.2
0.93%
jan 1, 1993
152.591
+22.591
17.38%
jan 1, 1994
125.613
-26.978
-17.68%
jan 1, 1995
116.419
-9.194
-7.32%
jan 1, 1996
105.065
-11.354
-9.75%
jan 1, 1997
106.221
+1.156
1.1%
jan 1, 1998
100.405
-5.816
-5.48%
jan 1, 1999
101.194
+0.788
0.79%
jan 1, 2000
99.936
-1.258
-1.24%
jan 1, 2001
93.743
-6.193
-6.2%
jan 1, 2002
90.851
-2.892
-3.08%
jan 1, 2003
85.093
-5.758
-6.34%
jan 1, 2004
88.939
+3.846
4.52%
jan 1, 2005
89.055
+0.116
0.13%
jan 1, 2006
79.952
-9.103
-10.22%
jan 1, 2007
72.625
-7.327
-9.16%
jan 1, 2008
69.959
-2.666
-3.67%
jan 1, 2009
56.785
-13.174
-18.83%
jan 1, 2010
61.011
+4.226
7.44%
jan 1, 2011
61.373
+0.363
0.59%
jan 1, 2012
61.855
+0.481
0.78%
jan 1, 2013
66.824
+4.969
8.03%
Ranking of countries by current statistics by years


Comments: