29
/
en
AIzaSyAYiBZKx7MnpbEhh9jyipgxe19OcubqV5w
April 1, 2024
90838
Brazil
BRA
true
2
1
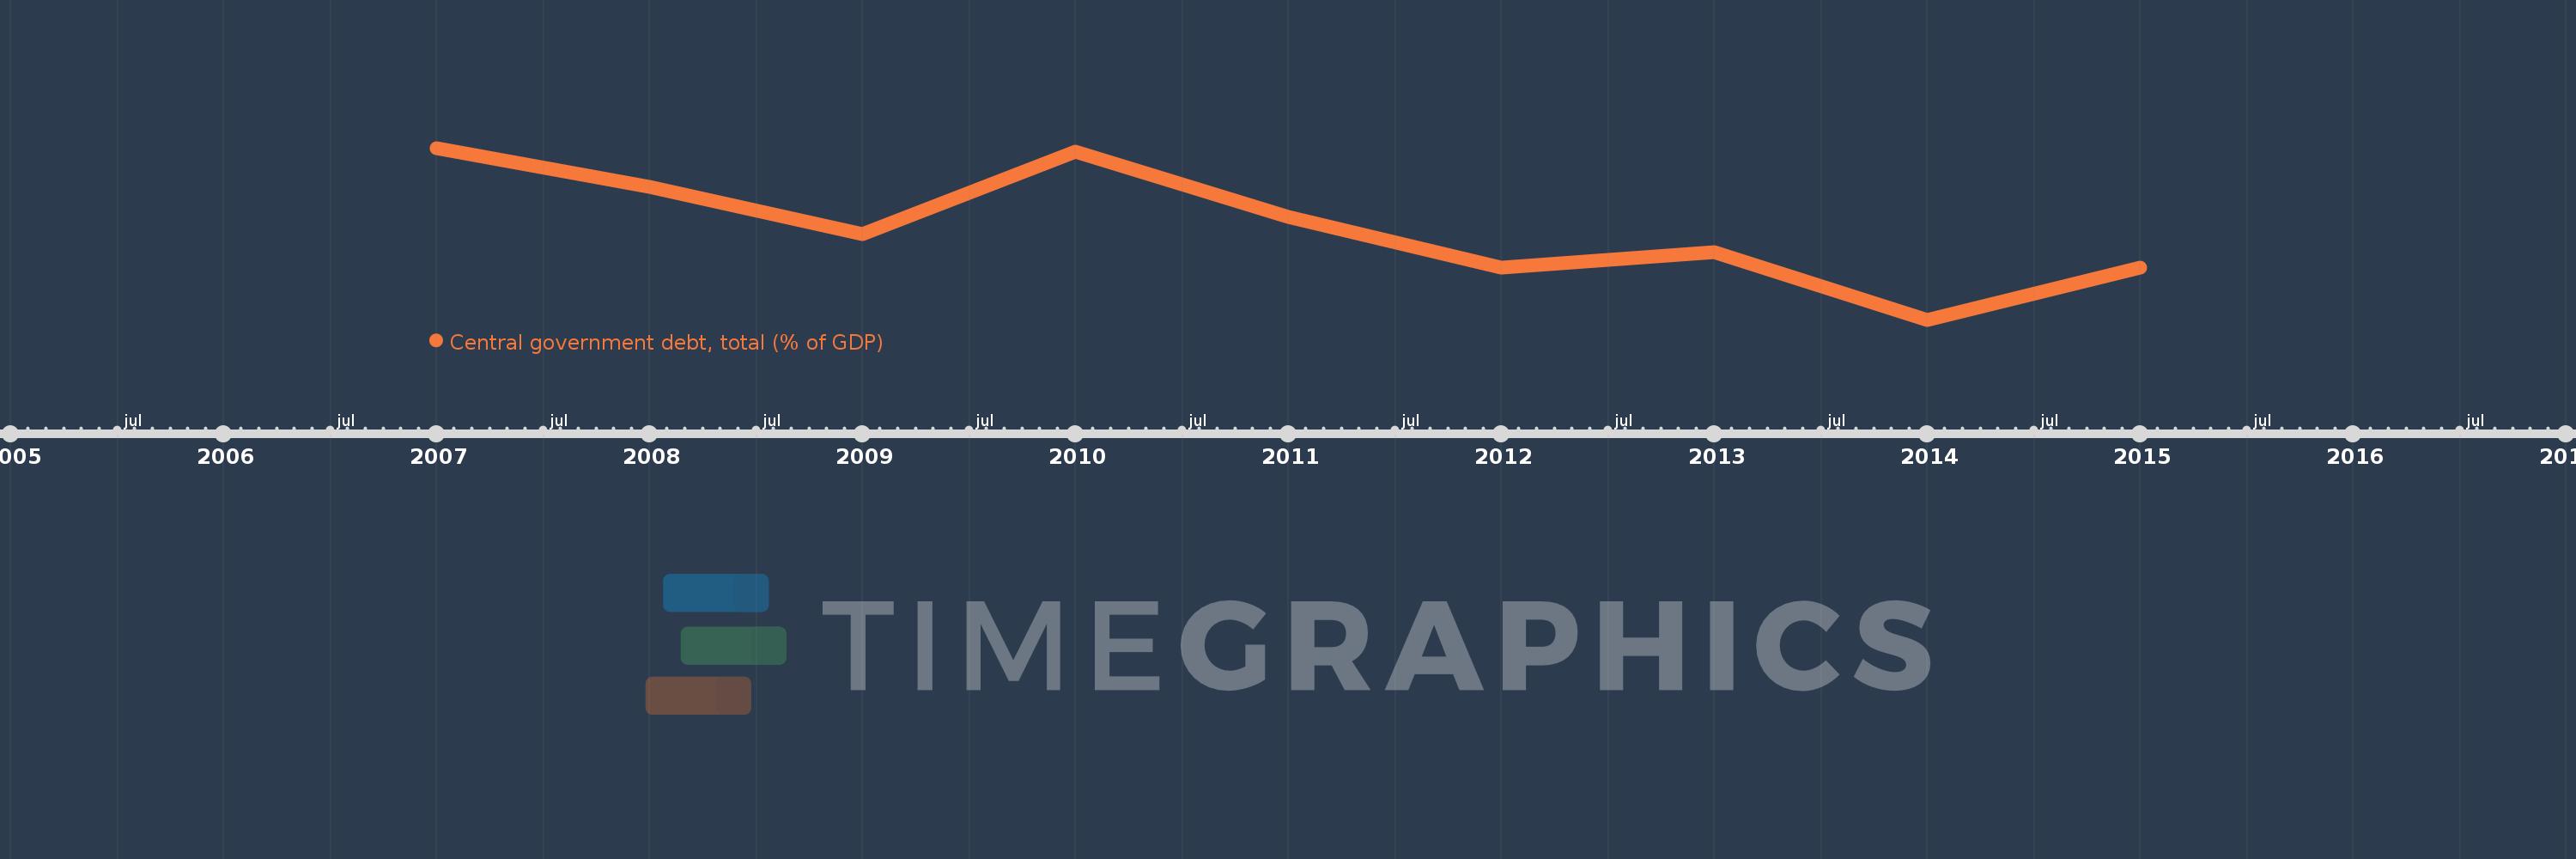
Central government debt, total (% of GDP)
2015,2014,2013,2012,2011,2010,2009,2008,2007
This statistics in other country:
Timeline:
This timeline shows a graph from 2007 to 2015 of Brazil. No data until 2006. Number of actual observations by date: 9.
Source name:
World Development Indicators
Source organization:
International Monetary Fund, Government Finance Statistics Yearbook and data files, and World Bank and OECD GDP estimates.
Categories, topics:
Economy & Growth, Public Sector
Last updated:
apr 23, 2017
Indicators value changes by year
Minimum:
57.392
jan 1, 2014
Maximum:
63.952
jan 1, 2007
At the date of observation
Value
Absolute change
Change from previous value
jan 1, 2007
63.952
+63.952
0.0%
jan 1, 2008
62.452
-1.501
-2.35%
jan 1, 2009
60.656
-1.796
-2.88%
jan 1, 2010
63.808
+3.152
5.2%
jan 1, 2011
61.319
-2.489
-3.9%
jan 1, 2012
59.379
-1.94
-3.16%
jan 1, 2013
59.96
+0.581
0.98%
jan 1, 2014
57.392
-2.568
-4.28%
jan 1, 2015
59.399
+2.008
3.5%
Ranking of countries by current statistics by years


Comments: