29
/
en
AIzaSyAYiBZKx7MnpbEhh9jyipgxe19OcubqV5w
April 1, 2024
65735
Algeria
DZA
true
2
1
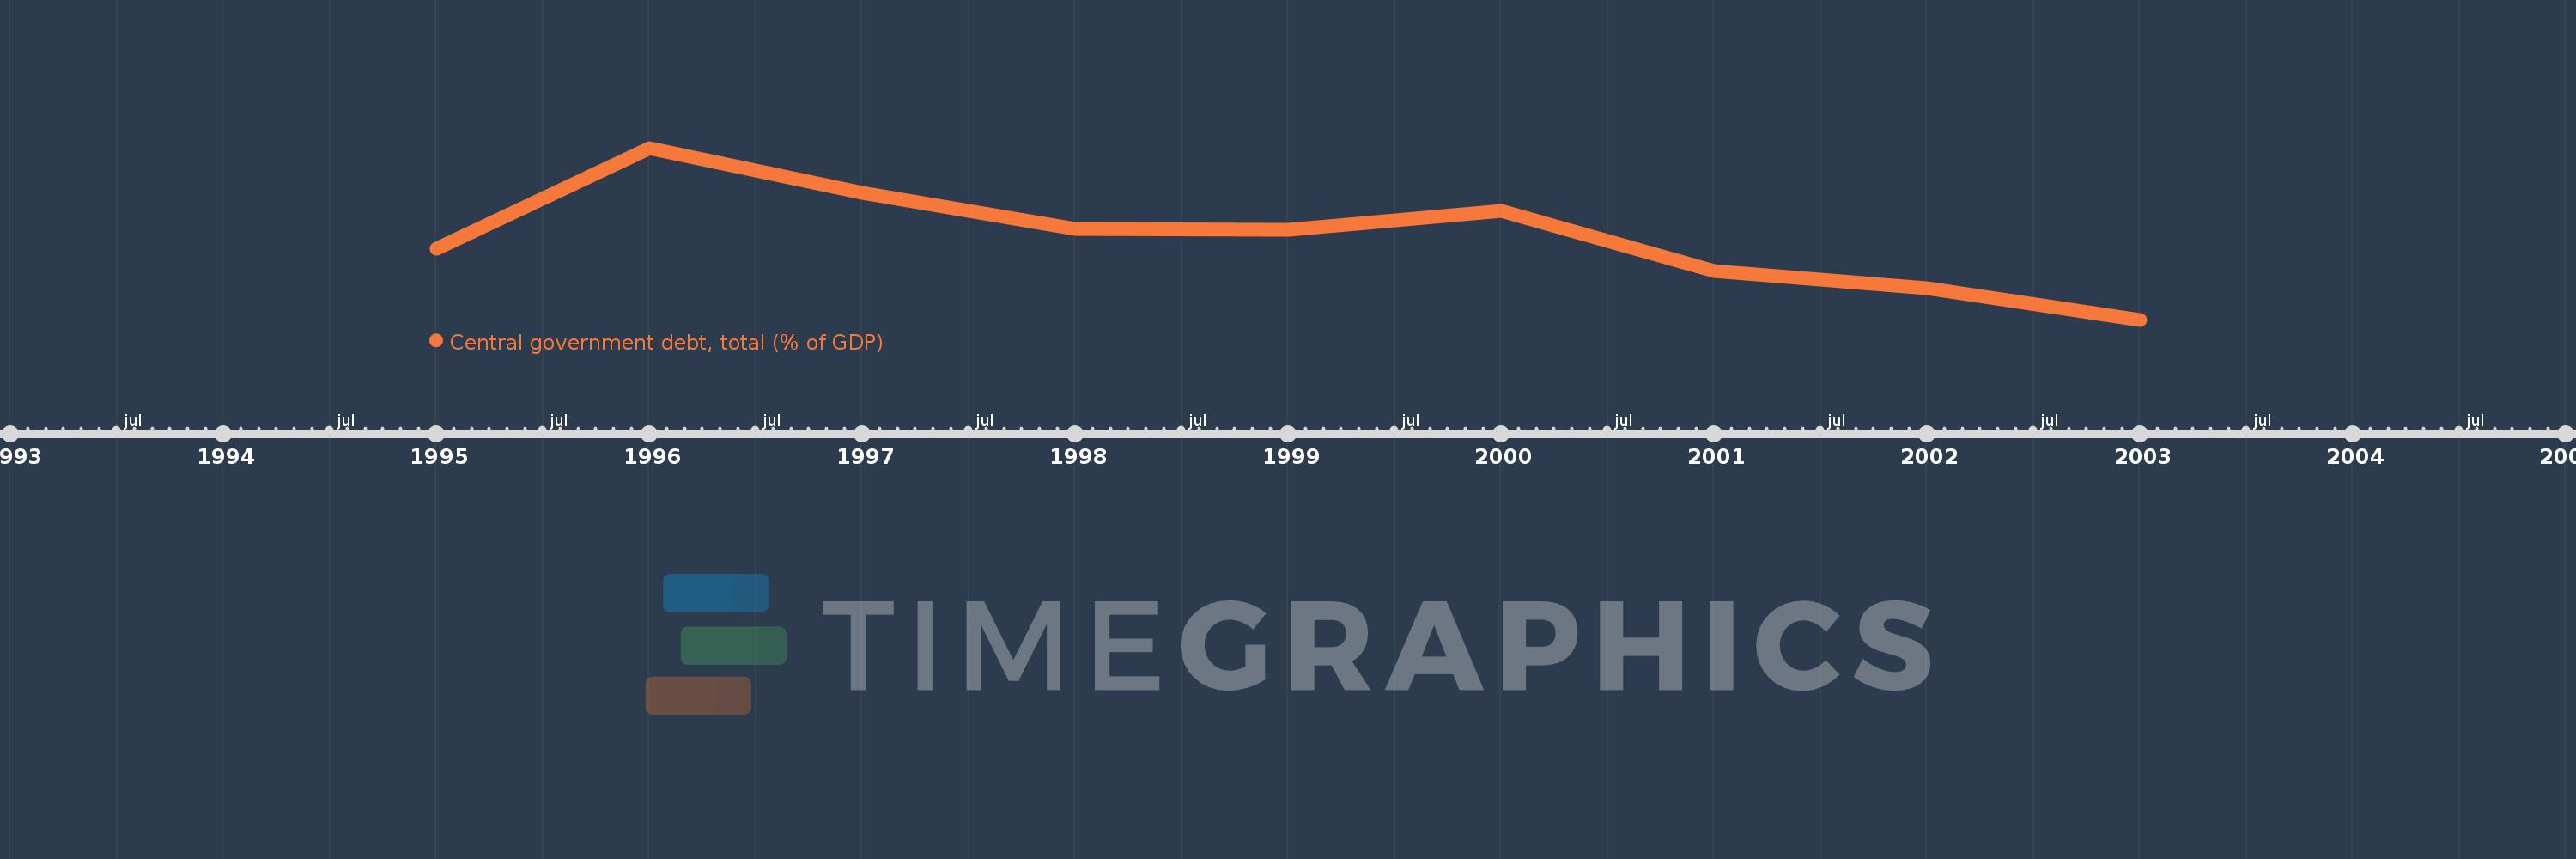
Central government debt, total (% of GDP)
2003,2002,2001,2000,1999,1998,1997,1996,1995
This statistics in other country:
Timeline:
This timeline shows a graph from 1995 to 2003 of Algeria. No data until 1994. Number of actual observations by date: 9.
Source name:
World Development Indicators
Source organization:
International Monetary Fund, Government Finance Statistics Yearbook and data files, and World Bank and OECD GDP estimates.
Categories, topics:
Economy & Growth, Public Sector
Last updated:
apr 23, 2017
Indicators value changes by year
Minimum:
47.334
jan 1, 2003
Maximum:
99.566
jan 1, 1996
At the date of observation
Value
Absolute change
Change from previous value
jan 1, 1995
68.862
+68.862
0.0%
jan 1, 1996
99.566
+30.704
44.59%
jan 1, 1997
85.836
-13.73
-13.79%
jan 1, 1998
75.053
-10.783
-12.56%
jan 1, 1999
74.68
-0.373
-0.5%
jan 1, 2000
80.498
+5.818
7.79%
jan 1, 2001
62.068
-18.43
-22.9%
jan 1, 2002
56.963
-5.105
-8.22%
jan 1, 2003
47.334
-9.629
-16.9%
Ranking of countries by current statistics by years


Comments: