29
/
en
AIzaSyAYiBZKx7MnpbEhh9jyipgxe19OcubqV5w
April 1, 2024
212668
Nigeria
NGA
true
2
1
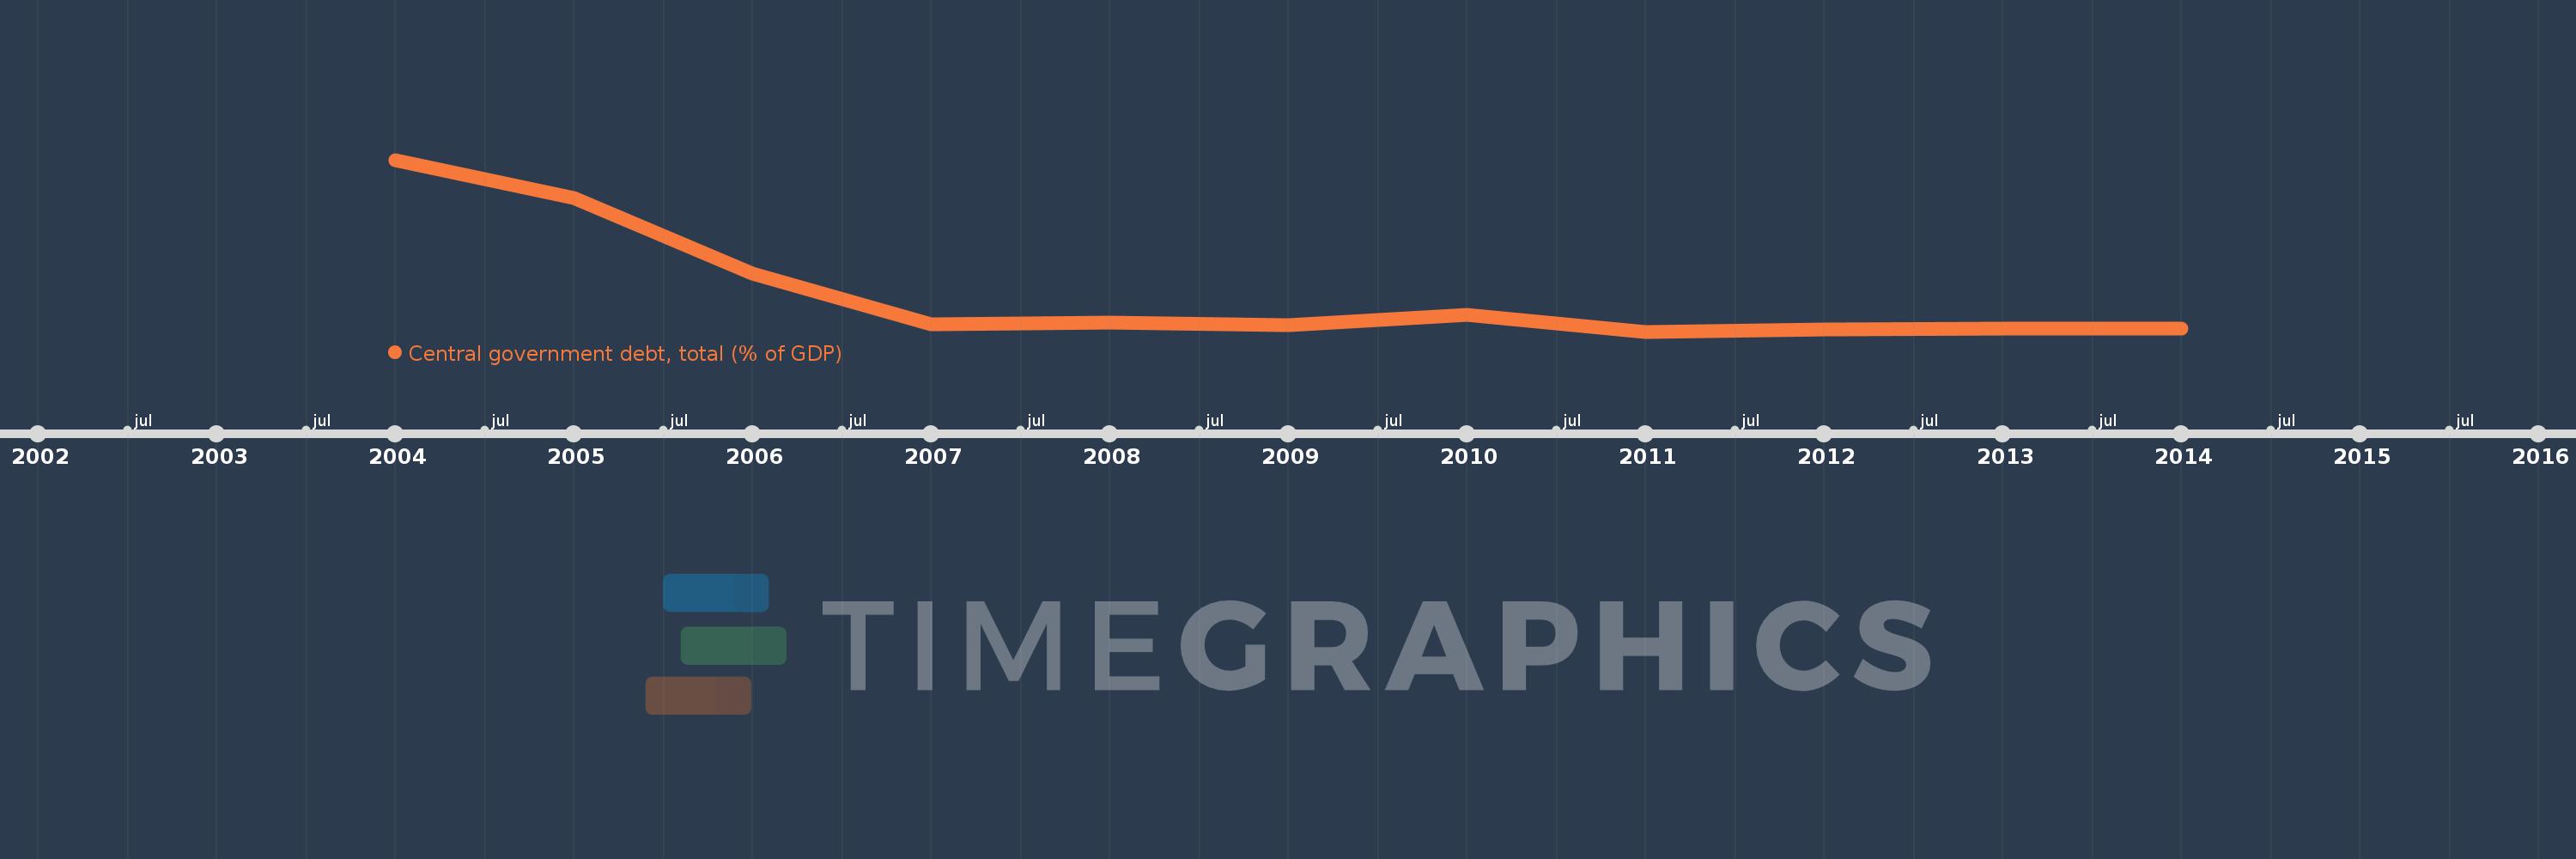
Central government debt, total (% of GDP)
2014,2013,2012,2011,2010,2009,2008,2007,2006,2005,2004
This statistics in other country:
Timeline:
This timeline shows a graph from 2004 to 2014 of Nigeria. No data until 2003. Number of actual observations by date: 11.
Source name:
World Development Indicators
Source organization:
International Monetary Fund, Government Finance Statistics Yearbook and data files, and World Bank and OECD GDP estimates.
Categories, topics:
Economy & Growth, Public Sector
Last updated:
apr 23, 2017
Indicators value changes by year
Maximum:
66.433
jan 1, 2004
At the date of observation
Value
Absolute change
Change from previous value
jan 1, 2004
66.433
+66.433
0.0%
jan 1, 2005
53.63
-12.803
-19.27%
jan 1, 2006
28.645
-24.985
-46.59%
jan 1, 2007
11.784
-16.861
-58.86%
jan 1, 2008
12.405
+0.621
5.27%
jan 1, 2009
11.529
-0.876
-7.06%
jan 1, 2010
15.131
+3.602
31.24%
jan 1, 2011
9.45
-5.681
-37.55%
jan 1, 2012
10.233
+0.783
8.29%
jan 1, 2013
10.419
+0.187
1.82%
jan 1, 2014
10.5
+0.081
0.78%
Ranking of countries by current statistics by years


Comments: