29
/
en
AIzaSyAYiBZKx7MnpbEhh9jyipgxe19OcubqV5w
April 1, 2024
241366
Slovak Republic
SVK
true
2
1
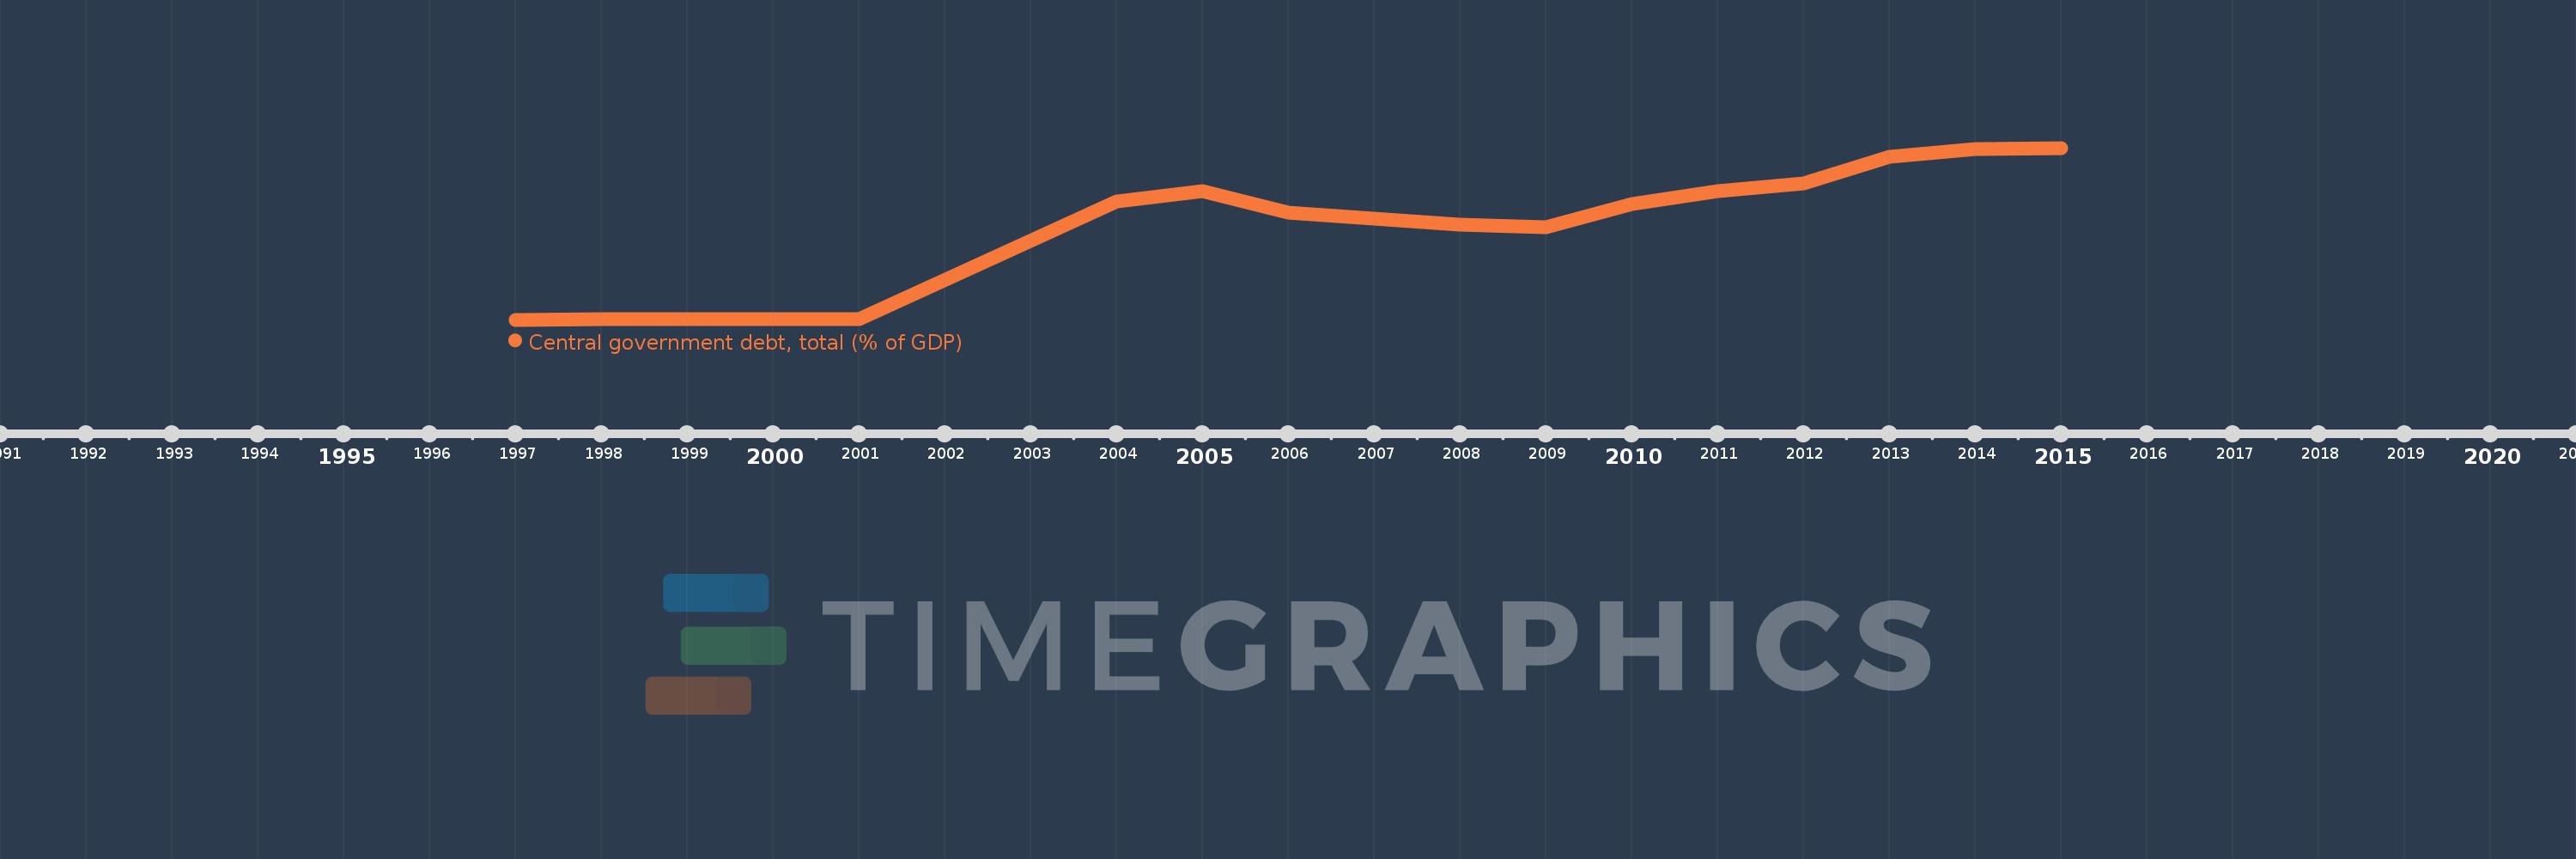
Central government debt, total (% of GDP)
2015,2014,2013,2012,2011,2010,2009,2008,2007,2006,2005,2004,2001,2000,1999,1998,1997
This statistics in other country:
Timeline:
This timeline shows a graph from 1997 to 2015 of Slovak Republic. No data until 1996. Number of actual observations by date: 17.
Source name:
World Development Indicators
Source organization:
International Monetary Fund, Government Finance Statistics Yearbook and data files, and World Bank and OECD GDP estimates.
Categories, topics:
Economy & Growth, Public Sector
Last updated:
apr 23, 2017
Indicators value changes by year
Maximum:
58.723
jan 1, 2015
At the date of observation
Value
Absolute change
Change from previous value
jan 1, 1997
0.595
+0.595
0.0%
jan 1, 1998
0.675
+0.081
13.57%
jan 1, 1999
0.734
+0.059
8.72%
jan 1, 2000
0.742
+0.008
1.06%
jan 1, 2001
0.776
+0.034
4.61%
jan 1, 2004
40.659
+39.882
5.14K%
jan 1, 2005
44.241
+3.583
8.81%
jan 1, 2006
36.741
-7.5
-16.95%
jan 1, 2007
34.944
-1.797
-4.89%
jan 1, 2008
32.662
-2.282
-6.53%
jan 1, 2009
31.852
-0.809
-2.48%
jan 1, 2010
39.625
+7.773
24.4%
jan 1, 2011
44.206
+4.581
11.56%
jan 1, 2012
46.704
+2.498
5.65%
jan 1, 2013
55.587
+8.883
19.02%
jan 1, 2014
58.482
+2.894
5.21%
jan 1, 2015
58.723
+0.241
0.41%
Ranking of countries by current statistics by years


Comments: