29
/
en
AIzaSyAYiBZKx7MnpbEhh9jyipgxe19OcubqV5w
April 1, 2024
235430
Senegal
SEN
true
2
1
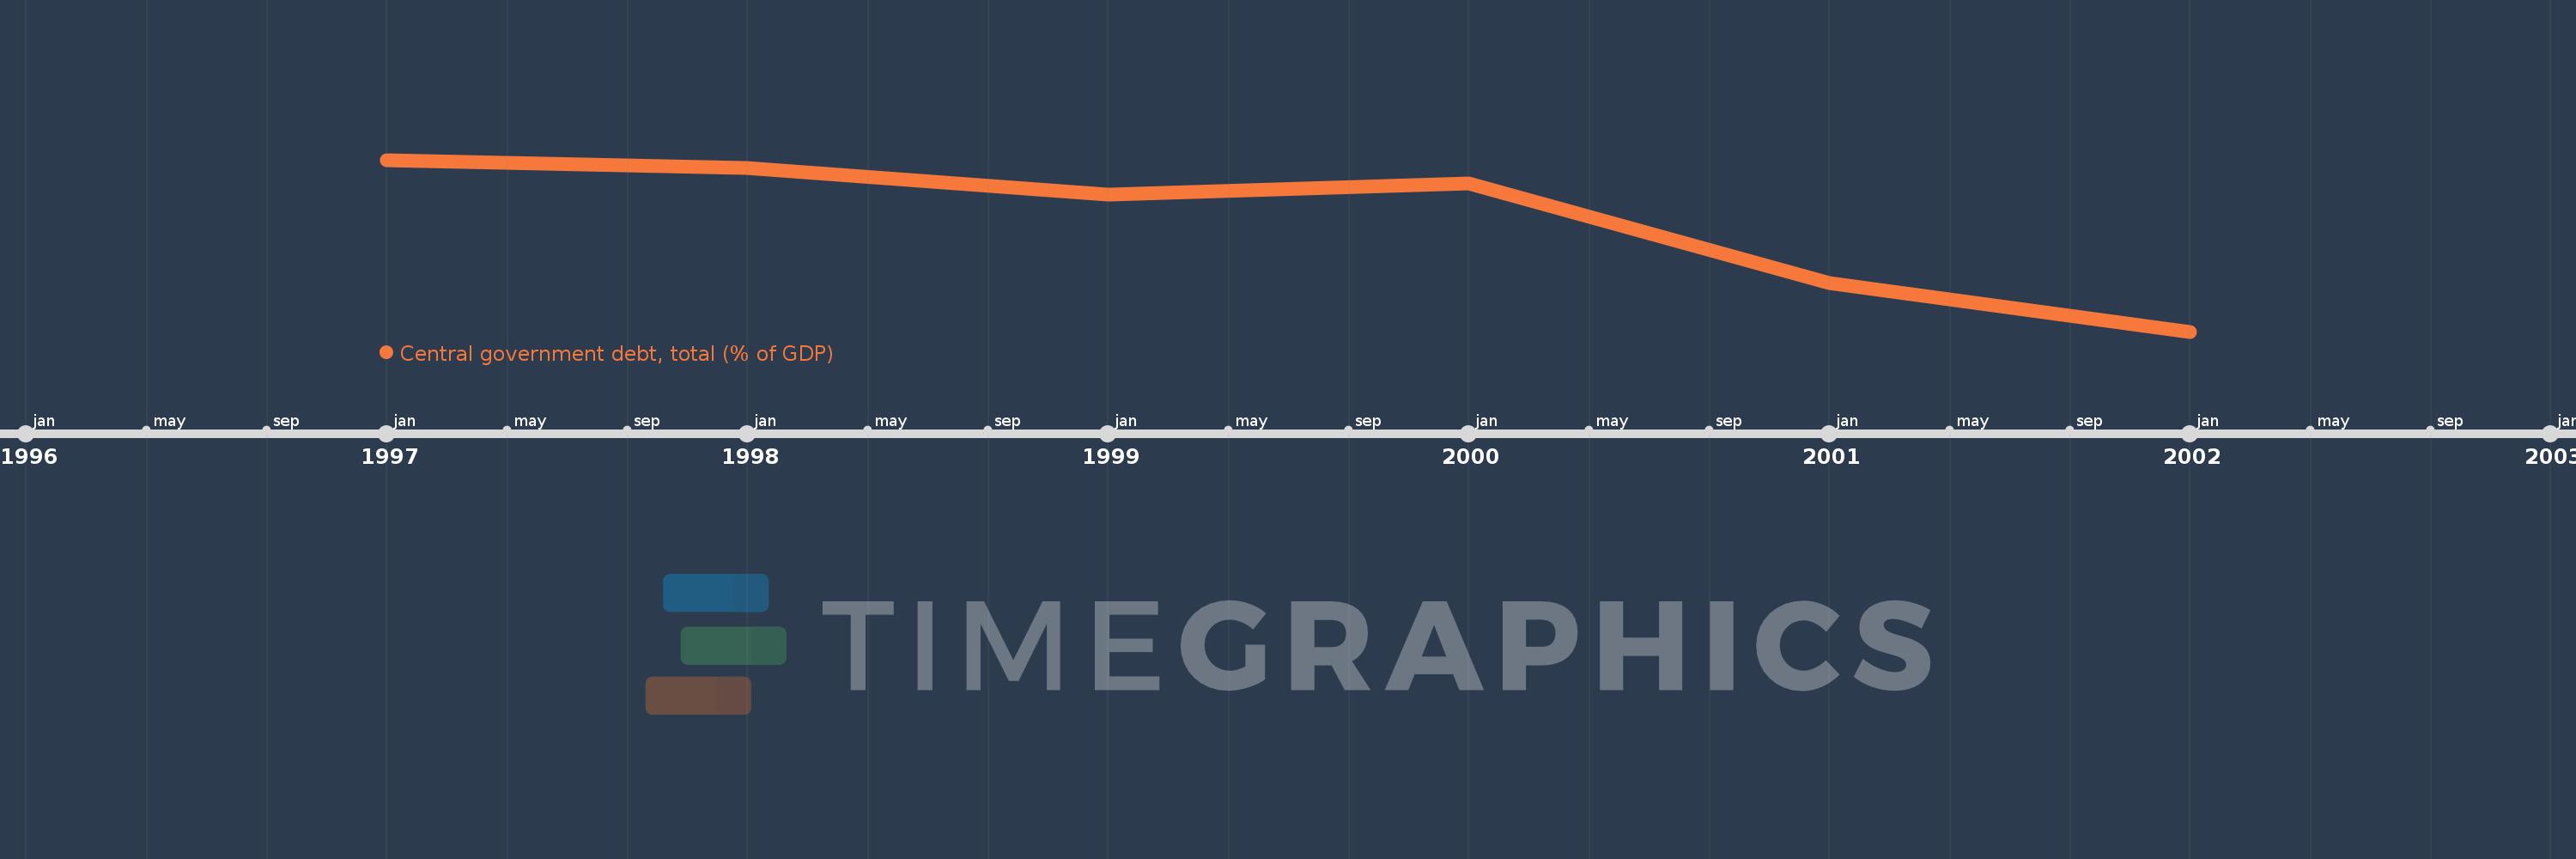
Central government debt, total (% of GDP)
2002,2001,2000,1999,1998,1997
This statistics in other country:
Timeline:
This timeline shows a graph from 1997 to 2002 of Senegal. No data until 1996. Number of actual observations by date: 6.
Source name:
World Development Indicators
Source organization:
International Monetary Fund, Government Finance Statistics Yearbook and data files, and World Bank and OECD GDP estimates.
Categories, topics:
Economy & Growth, Public Sector
Last updated:
apr 23, 2017
Indicators value changes by year
Minimum:
68.852
jan 1, 2002
Maximum:
85.983
jan 1, 1997
At the date of observation
Value
Absolute change
Change from previous value
jan 1, 1997
85.983
+85.983
0.0%
jan 1, 1998
85.15
-0.833
-0.97%
jan 1, 1999
82.506
-2.644
-3.1%
jan 1, 2000
83.614
+1.108
1.34%
jan 1, 2001
73.724
-9.89
-11.83%
jan 1, 2002
68.852
-4.871
-6.61%
Ranking of countries by current statistics by years


Comments: