29
/
en
AIzaSyAYiBZKx7MnpbEhh9jyipgxe19OcubqV5w
April 1, 2024
243391
Solomon Islands
SLB
true
2
1
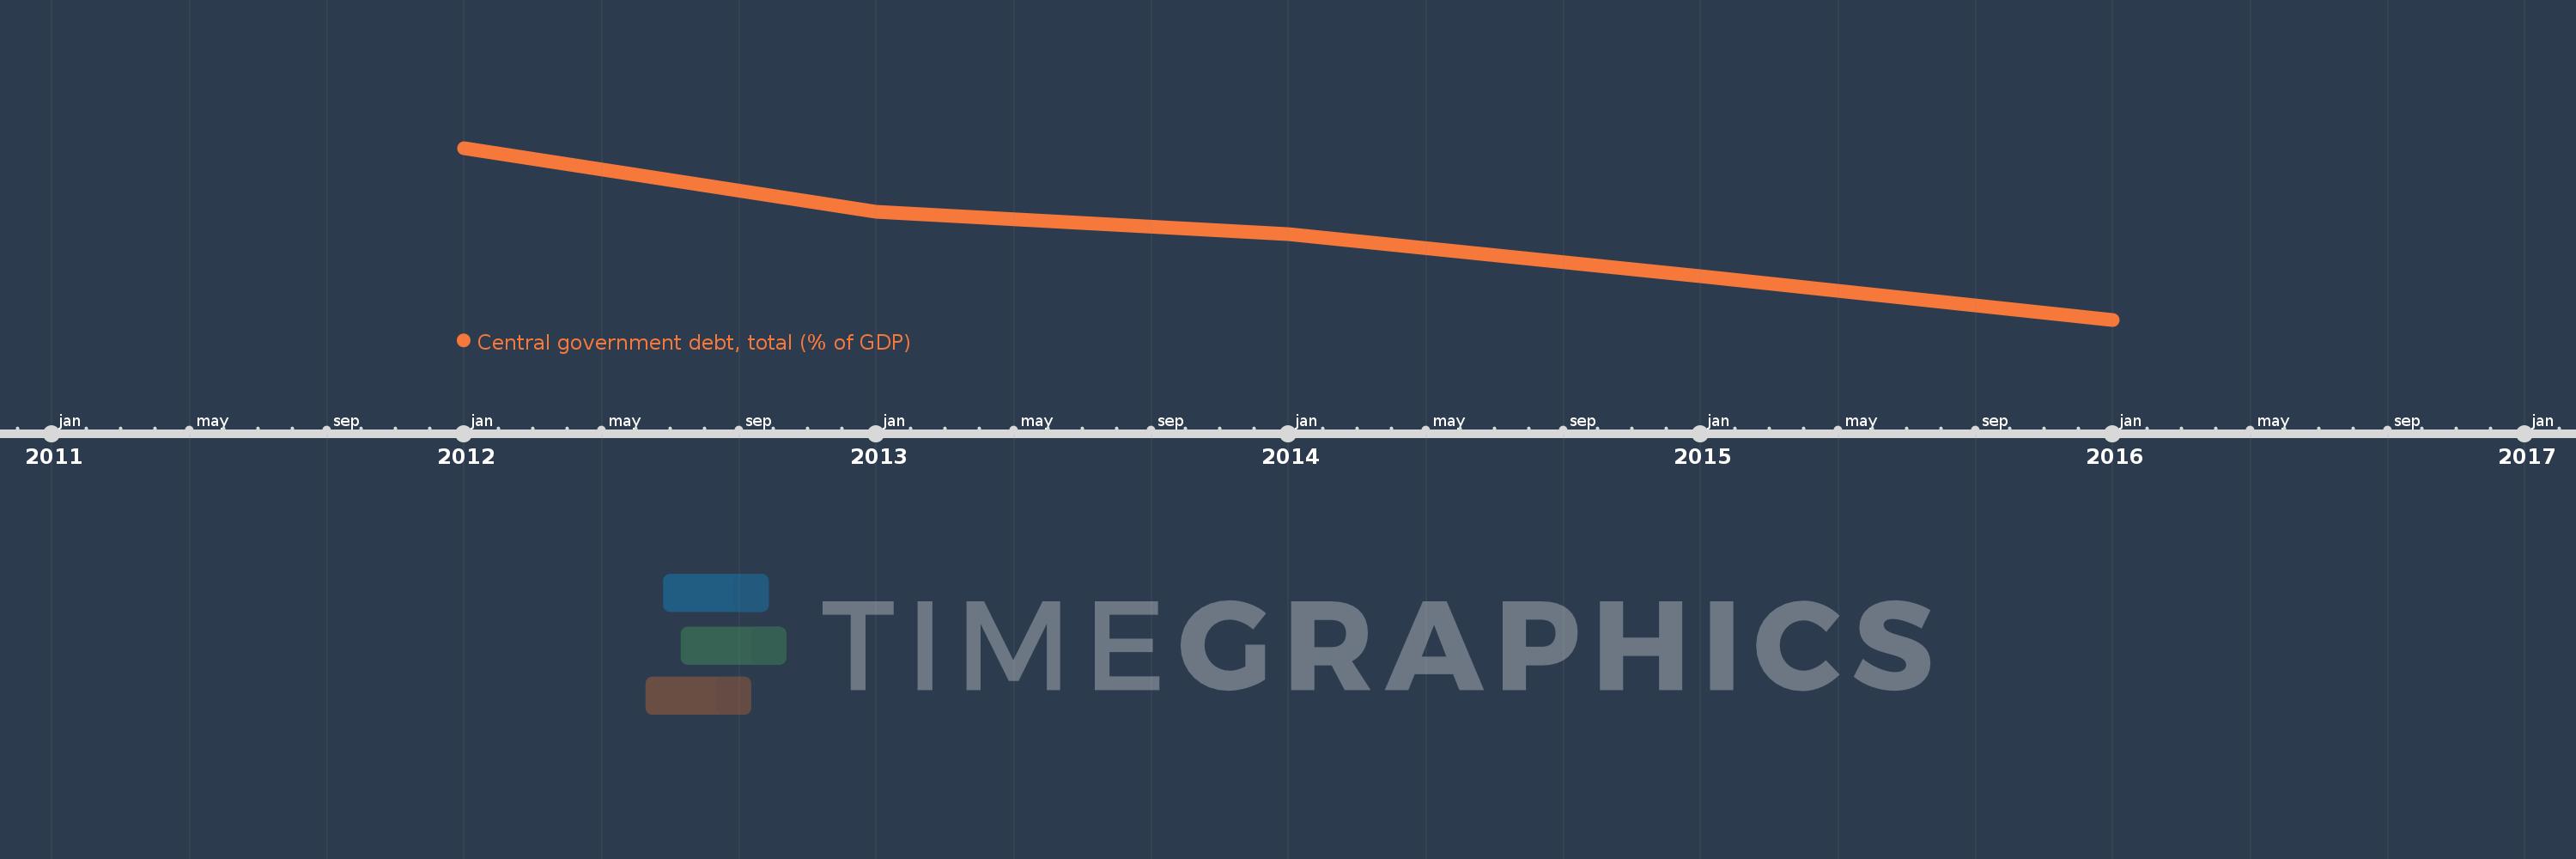
Central government debt, total (% of GDP)
2016,2015,2014,2013,2012
This statistics in other country:
Timeline:
This timeline shows a graph from 2012 to 2016 of Solomon Islands. No data until 2011. Number of actual observations by date: 5.
Source name:
World Development Indicators
Source organization:
International Monetary Fund, Government Finance Statistics Yearbook and data files, and World Bank and OECD GDP estimates.
Categories, topics:
Economy & Growth, Public Sector
Last updated:
apr 23, 2017
Indicators value changes by year
Maximum:
16.714
jan 1, 2012
At the date of observation
Value
Absolute change
Change from previous value
jan 1, 2012
16.714
+16.714
0.0%
jan 1, 2013
13.403
-3.311
-19.81%
jan 1, 2014
12.263
-1.14
-8.51%
jan 1, 2015
10.07
-2.192
-17.88%
jan 1, 2016
7.804
-2.266
-22.5%
Ranking of countries by current statistics by years


Comments: