29
/
en
AIzaSyAYiBZKx7MnpbEhh9jyipgxe19OcubqV5w
April 1, 2024
277401
Uruguay
URY
true
2
1
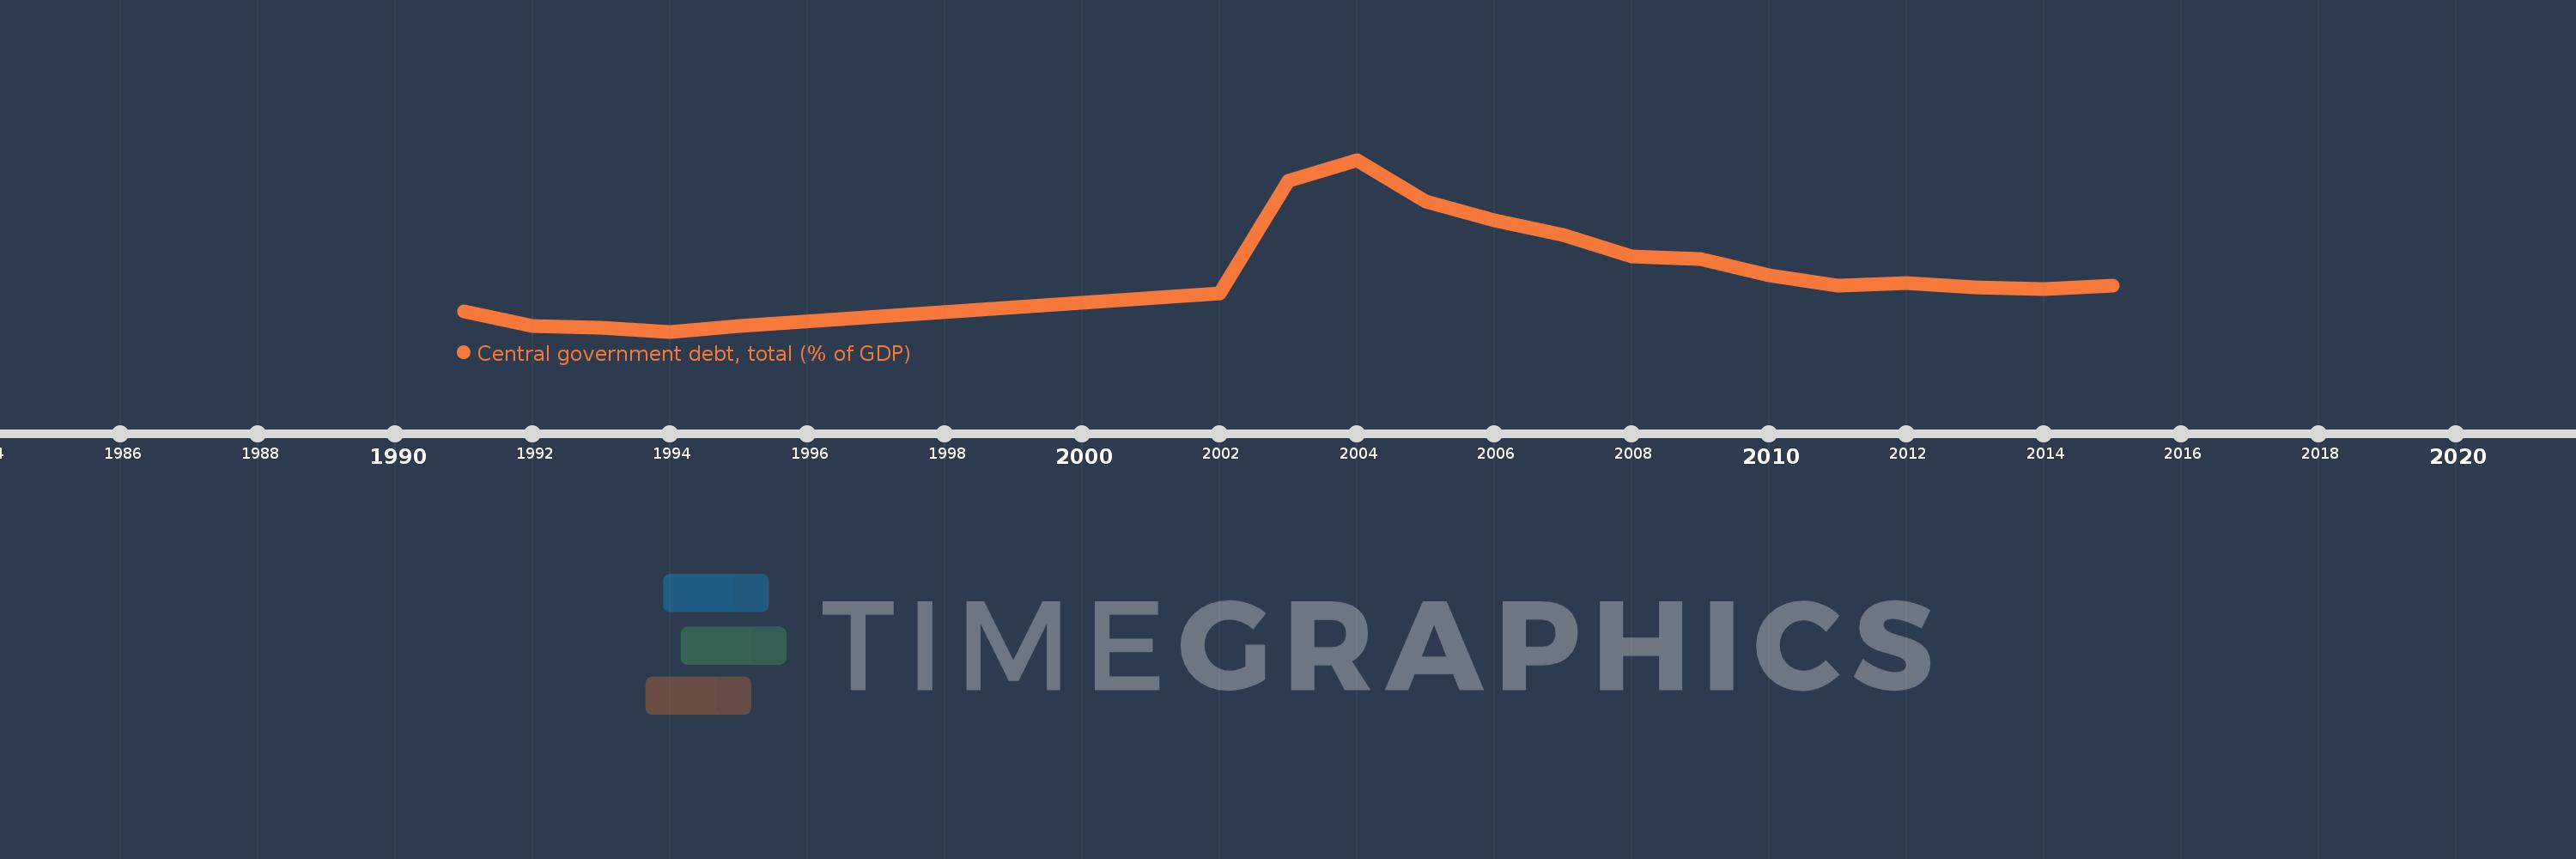
Central government debt, total (% of GDP)
2015,2014,2013,2012,2011,2010,2009,2008,2007,2006,2005,2004,2003,2002,1995,1994,1993,1992,1991
This statistics in other country:
Timeline:
This timeline shows a graph from 1991 to 2015 of Uruguay. No data until 1990. Number of actual observations by date: 19.
Source name:
World Development Indicators
Source organization:
International Monetary Fund, Government Finance Statistics Yearbook and data files, and World Bank and OECD GDP estimates.
Categories, topics:
Economy & Growth, Public Sector
Last updated:
apr 23, 2017
Indicators value changes by year
Minimum:
21.879
jan 1, 1994
Maximum:
105.603
jan 1, 2004
At the date of observation
Value
Absolute change
Change from previous value
jan 1, 1991
31.596
+31.596
0.0%
jan 1, 1992
24.591
-7.005
-22.17%
jan 1, 1993
23.605
-0.986
-4.01%
jan 1, 1994
21.879
-1.726
-7.31%
jan 1, 1995
24.53
+2.651
12.12%
jan 1, 2002
40.643
+16.113
65.69%
jan 1, 2003
95.268
+54.625
134.4%
jan 1, 2004
105.603
+10.335
10.85%
jan 1, 2005
85.426
-20.177
-19.11%
jan 1, 2006
76.114
-9.311
-10.9%
jan 1, 2007
69.027
-7.088
-9.31%
jan 1, 2008
58.512
-10.515
-15.23%
jan 1, 2009
57.253
-1.259
-2.15%
jan 1, 2010
49.273
-7.979
-13.94%
jan 1, 2011
44.223
-5.051
-10.25%
jan 1, 2012
45.351
+1.129
2.55%
jan 1, 2013
43.403
-1.948
-4.3%
jan 1, 2014
42.741
-0.663
-1.53%
jan 1, 2015
44.358
+1.617
3.78%
Ranking of countries by current statistics by years


Comments: