29
/
en
AIzaSyAYiBZKx7MnpbEhh9jyipgxe19OcubqV5w
April 1, 2024
55568
Pre-demographic dividend
PRE
false
2
1
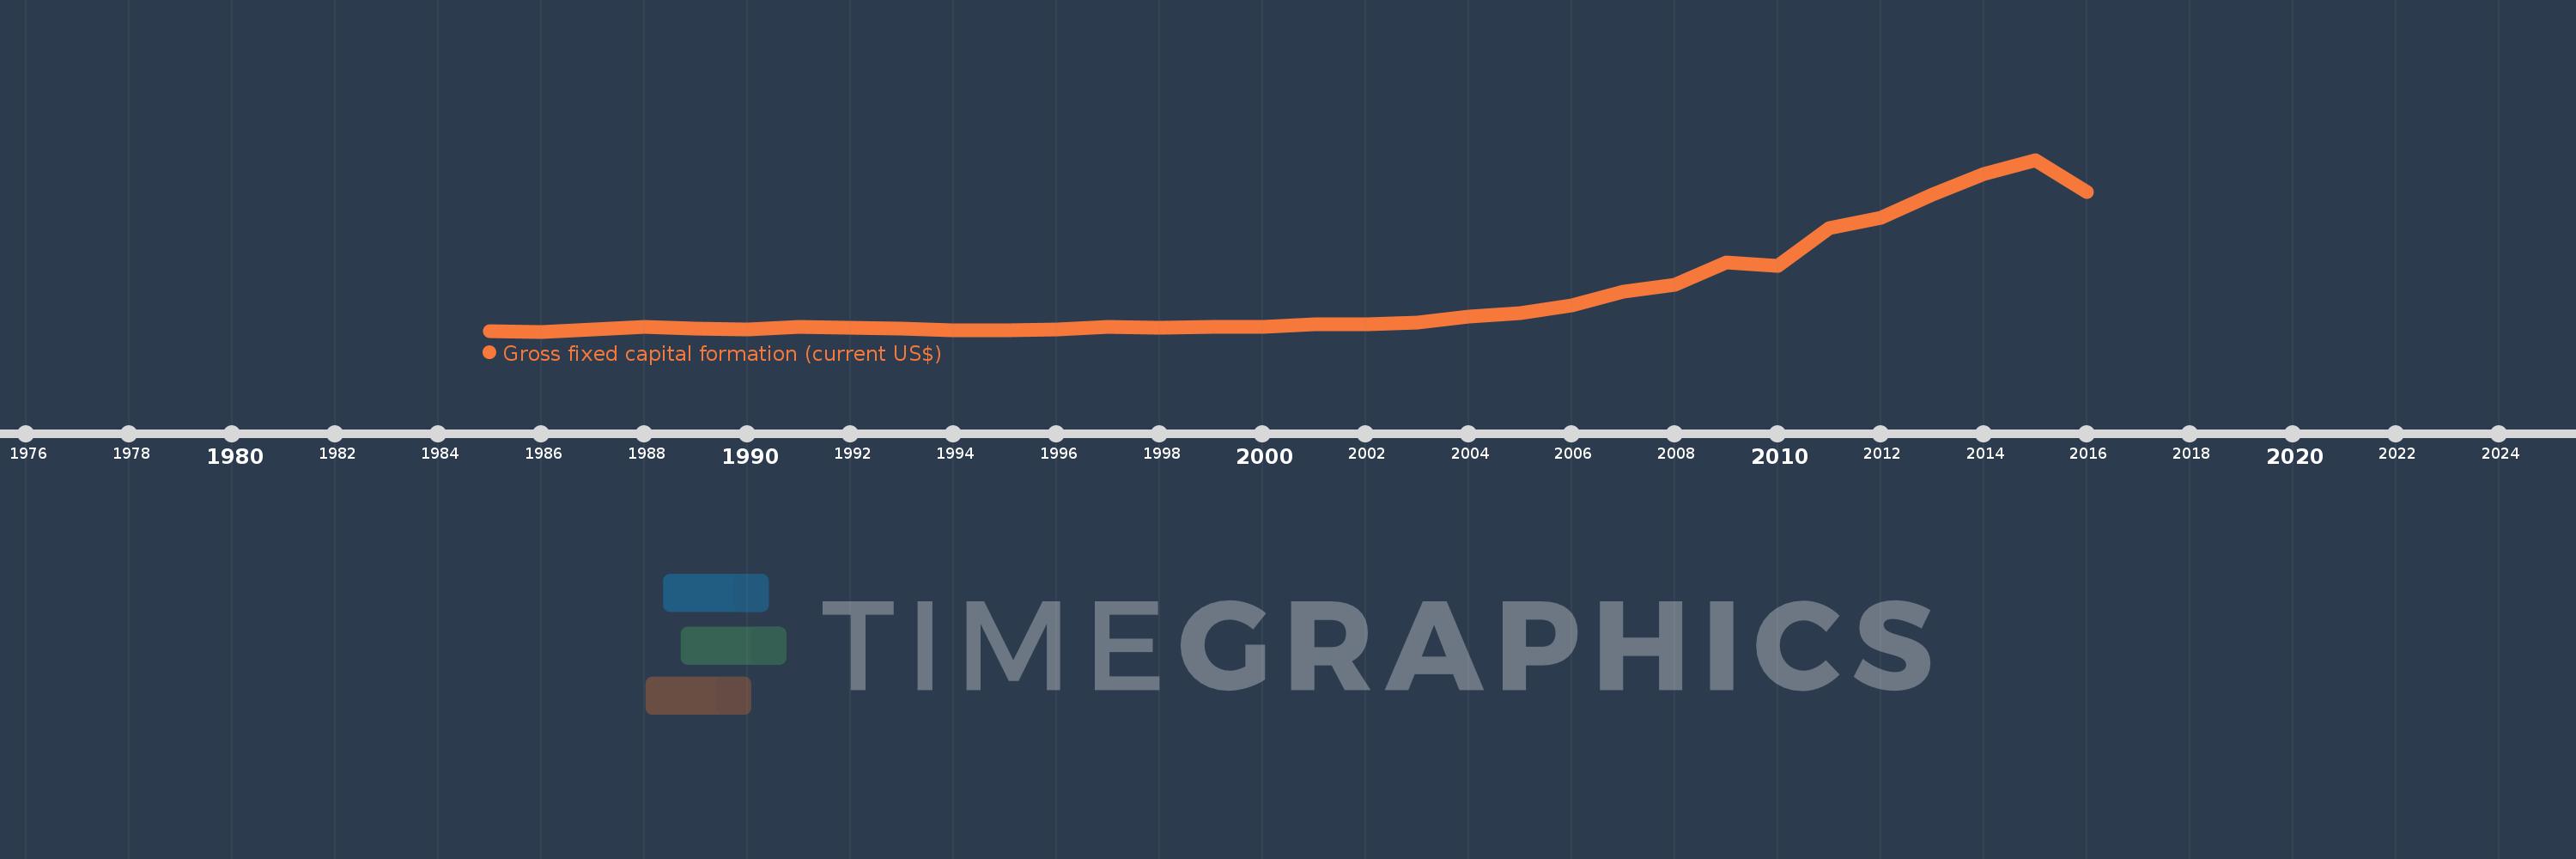
Gross fixed capital formation (current US$)
2016,2015,2014,2013,2012,2011,2010,2009,2008,2007,2006,2005,2004,2003,2002,2001,2000,1999,1998,1997,1996,1995,1994,1993,1992,1991,1990,1989,1988,1987,1986,1985
This statistics in other country:
AfghanistanAlbaniaAlgeriaAngolaAntigua and BarbudaArab WorldArgentinaArmeniaArubaAustraliaAustriaAzerbaijanBahamas, TheBahrainBangladeshBarbadosBelarusBelgiumBelizeBeninBermudaBhutanBoliviaBosnia and HerzegovinaBotswanaBrazilBrunei DarussalamBulgariaBurkina FasoBurundiCabo VerdeCambodiaCameroonCanadaCaribbean small statesCentral African RepublicCentral Europe and the BalticsChadChileChinaColombiaComorosCongo, Dem. Rep.Congo, Rep.Costa RicaCote d'IvoireCroatiaCubaCyprusCzech RepublicDenmarkDjiboutiDominicaDominican RepublicEarly-demographic dividendEast Asia & PacificEast Asia & Pacific (excluding high income)East Asia & Pacific (IDA & IBRD countries)EcuadorEgypt, Arab Rep.El SalvadorEquatorial GuineaEritreaEstoniaEthiopiaEuro areaEurope & Central AsiaEurope & Central Asia (excluding high income)Europe & Central Asia (IDA & IBRD countries)European UnionFijiFinlandFragile and conflict affected situationsFranceGabonGambia, TheGeorgiaGermanyGhanaGreeceGrenadaGuatemalaGuineaGuinea-BissauGuyanaHaitiHeavily indebted poor countries (HIPC)High incomeHondurasHong Kong SAR, ChinaHungaryIBRD onlyIcelandIDA & IBRD totalIDA blendIDA onlyIDA totalIndiaIndonesiaIran, Islamic Rep.IraqIrelandIsraelItalyJamaicaJapanJordanKazakhstanKenyaKiribatiKorea, Rep.KosovoKuwaitKyrgyz RepublicLao PDRLate-demographic dividendLatin America & Caribbean Latin America & Caribbean (excluding high income)Latin America & the Caribbean (IDA & IBRD countries)LatviaLeast developed countries: UN classificationLebanonLesothoLiberiaLibyaLithuaniaLow & middle incomeLow incomeLower middle incomeLuxembourgMacao SAR, ChinaMacedonia, FYRMadagascarMalawiMalaysiaMaldivesMaliMaltaMauritaniaMauritiusMexicoMicronesia, Fed. Sts.Middle East & North AfricaMiddle East & North Africa (excluding high income)Middle East & North Africa (IDA & IBRD countries)Middle incomeMoldovaMongoliaMontenegroMoroccoMozambiqueNamibiaNepalNetherlandsNew CaledoniaNew ZealandNicaraguaNigerNigeriaNorth AmericaNorwayOECD membersOmanPakistanPanamaPapua New GuineaParaguayPeruPhilippinesPolandPortugalPost-demographic dividendPre-demographic dividendPuerto RicoRomaniaRussian FederationRwandaSaudi ArabiaSenegalSerbiaSeychellesSierra LeoneSingaporeSlovak RepublicSloveniaSolomon IslandsSomaliaSouth AfricaSouth AsiaSouth Asia (IDA & IBRD)South SudanSpainSri LankaSt. Kitts and NevisSt. LuciaSt. Vincent and the GrenadinesSub-Saharan Africa Sub-Saharan Africa (excluding high income)Sub-Saharan Africa (IDA & IBRD countries)SudanSurinameSwazilandSwedenSwitzerlandSyrian Arab RepublicTajikistanTanzaniaThailandTimor-LesteTogoTongaTrinidad and TobagoTunisiaTurkeyTurkmenistanUgandaUkraineUnited Arab EmiratesUnited KingdomUnited StatesUpper middle incomeUruguayUzbekistanVanuatuVenezuela, RBVietnamWest Bank and GazaWorldYemen, Rep.ZambiaZimbabwe Timeline:
This timeline shows a graph from 1985 to 2016 of Pre-demographic dividend. No data until 1984. Number of actual observations by date: 32.
Source name:
World Development Indicators
Source organization:
World Bank national accounts data, and OECD National Accounts data files.
Categories, topics:
Economy & Growth
Last updated:
apr 23, 2017
Indicators value changes by year
Minimum:
16.73 bln
jan 1, 1986
Maximum:
299.193 bln
jan 1, 2015
At the date of observation
Value
Absolute change
Change from previous value
jan 1, 1985
18.086 bln
+18.086 bln
0.0%
jan 1, 1986
16.73 bln
-1.356 bln
-7.5%
jan 1, 1987
20.53 bln
+3.8 bln
22.71%
jan 1, 1988
23.797 bln
+3.267 bln
15.92%
jan 1, 1989
21.845 bln
-1.952 bln
-8.2%
jan 1, 1990
20.384 bln
-1.461 bln
-6.69%
jan 1, 1991
24.232 bln
+3.848 bln
18.88%
jan 1, 1992
22.957 bln
-1.275 bln
-5.26%
jan 1, 1993
21.605 bln
-1.351 bln
-5.89%
jan 1, 1994
19.087 bln
-2.518 bln
-11.65%
jan 1, 1995
19.463 bln
+375.847 mln
1.97%
jan 1, 1996
20.933 bln
+1.47 bln
7.55%
jan 1, 1997
25.166 bln
+4.233 bln
20.22%
jan 1, 1998
23.005 bln
-2.161 bln
-8.59%
jan 1, 1999
24.919 bln
+1.913 bln
8.32%
jan 1, 2000
24.636 bln
-282.878 mln
-1.14%
jan 1, 2001
28.673 bln
+4.037 bln
16.39%
jan 1, 2002
28.586 bln
-86.687 mln
-0.3%
jan 1, 2003
31.359 bln
+2.773 bln
9.7%
jan 1, 2004
40.804 bln
+9.446 bln
30.12%
jan 1, 2005
47.05 bln
+6.245 bln
15.31%
jan 1, 2006
59.298 bln
+12.248 bln
26.03%
jan 1, 2007
82.047 bln
+22.749 bln
38.36%
jan 1, 2008
94.336 bln
+12.289 bln
14.98%
jan 1, 2009
129.766 bln
+35.43 bln
37.56%
jan 1, 2010
124.566 bln
-5.2 bln
-4.01%
jan 1, 2011
186.833 bln
+62.267 bln
49.99%
jan 1, 2012
204.057 bln
+17.224 bln
9.22%
jan 1, 2013
242.401 bln
+38.344 bln
18.79%
jan 1, 2014
276.363 bln
+33.962 bln
14.01%
jan 1, 2015
299.193 bln
+22.83 bln
8.26%
jan 1, 2016
246.652 bln
-52.54 bln
-17.56%
Ranking of countries by current statistics by years


Comments: