29
/
en
AIzaSyAYiBZKx7MnpbEhh9jyipgxe19OcubqV5w
April 1, 2024
202984
Mozambique
MOZ
true
2
1
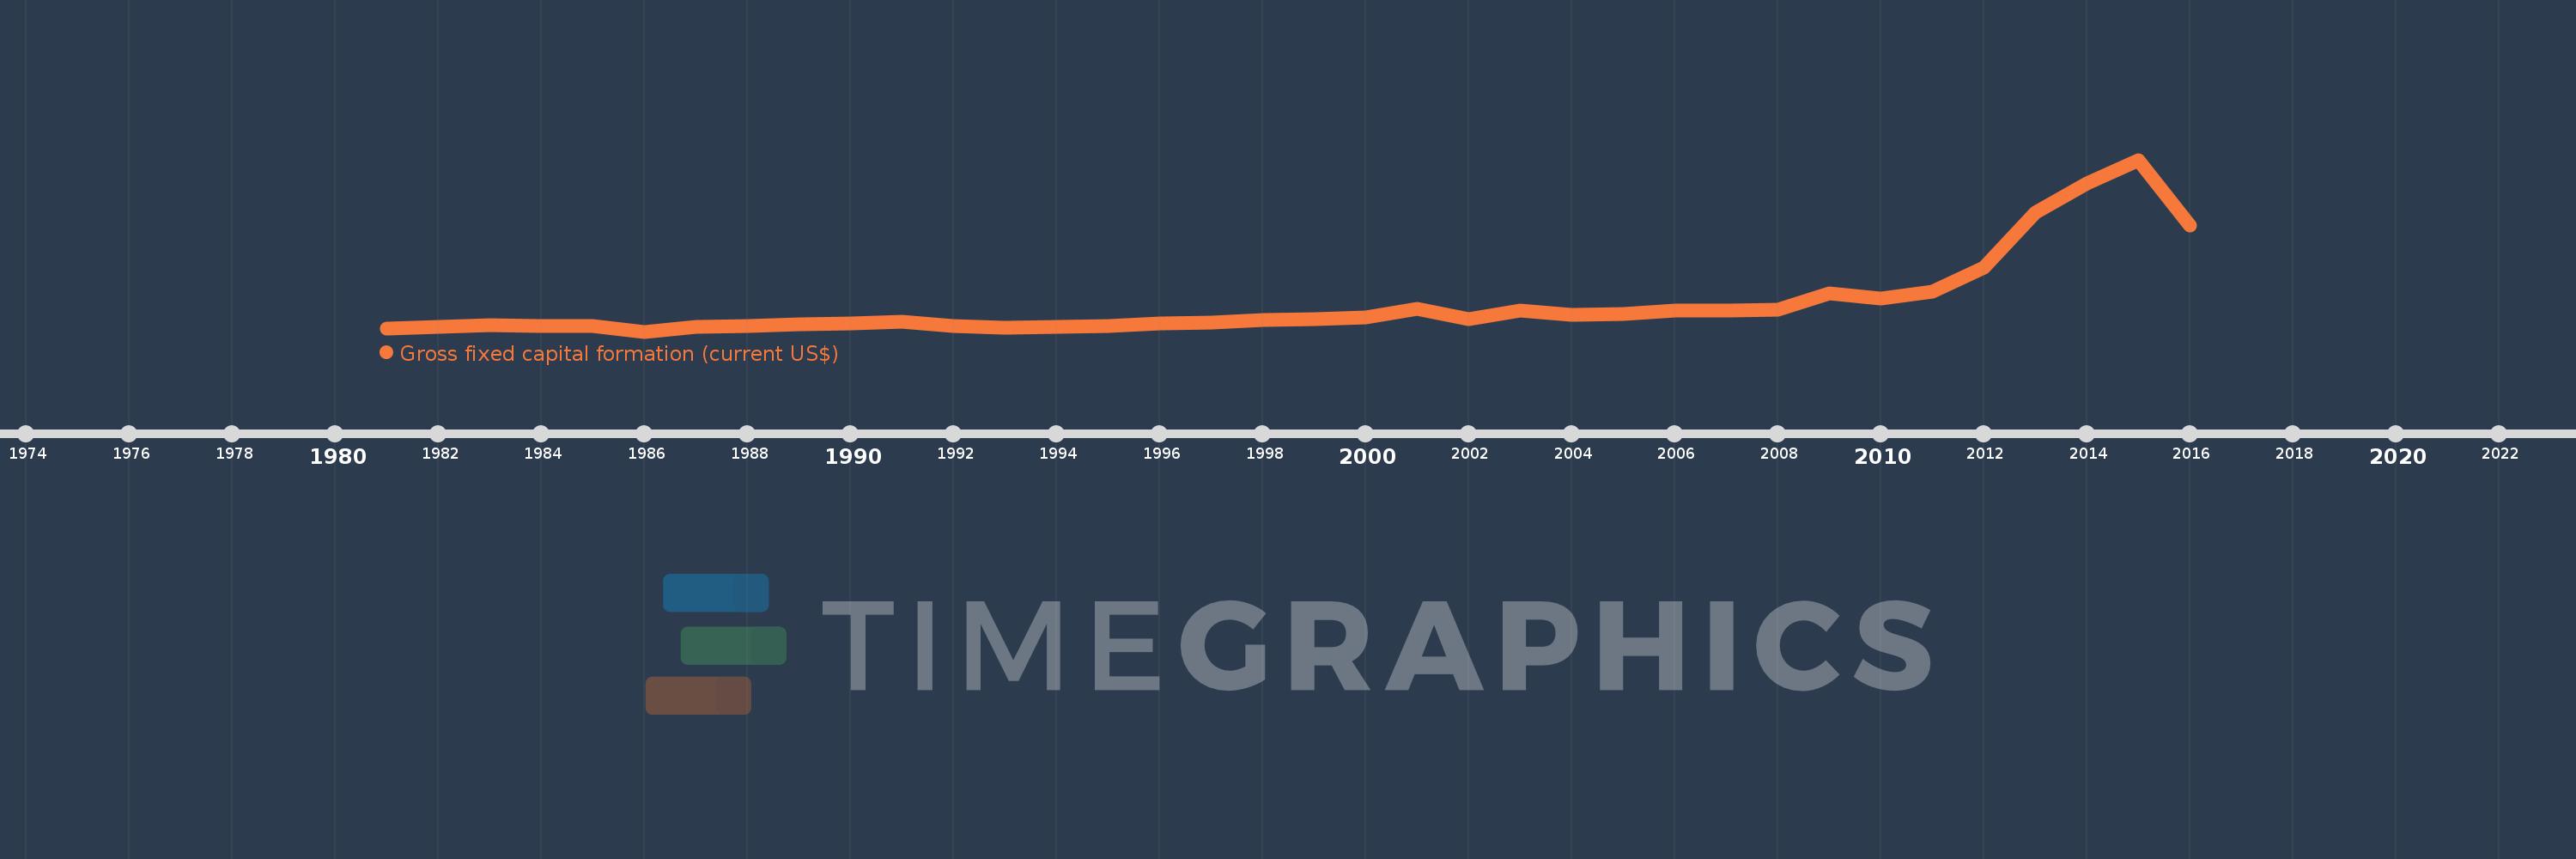
Gross fixed capital formation (current US$)
2016,2015,2014,2013,2012,2011,2010,2009,2008,2007,2006,2005,2004,2003,2002,2001,2000,1999,1998,1997,1996,1995,1994,1993,1992,1991,1990,1989,1988,1987,1986,1985,1984,1983,1982,1981
This statistics in other country:
AfghanistanAlbaniaAlgeriaAngolaAntigua and BarbudaArab WorldArgentinaArmeniaArubaAustraliaAustriaAzerbaijanBahamas, TheBahrainBangladeshBarbadosBelarusBelgiumBelizeBeninBermudaBhutanBoliviaBosnia and HerzegovinaBotswanaBrazilBrunei DarussalamBulgariaBurkina FasoBurundiCabo VerdeCambodiaCameroonCanadaCaribbean small statesCentral African RepublicCentral Europe and the BalticsChadChileChinaColombiaComorosCongo, Dem. Rep.Congo, Rep.Costa RicaCote d'IvoireCroatiaCubaCyprusCzech RepublicDenmarkDjiboutiDominicaDominican RepublicEarly-demographic dividendEast Asia & PacificEast Asia & Pacific (excluding high income)East Asia & Pacific (IDA & IBRD countries)EcuadorEgypt, Arab Rep.El SalvadorEquatorial GuineaEritreaEstoniaEthiopiaEuro areaEurope & Central AsiaEurope & Central Asia (excluding high income)Europe & Central Asia (IDA & IBRD countries)European UnionFijiFinlandFragile and conflict affected situationsFranceGabonGambia, TheGeorgiaGermanyGhanaGreeceGrenadaGuatemalaGuineaGuinea-BissauGuyanaHaitiHeavily indebted poor countries (HIPC)High incomeHondurasHong Kong SAR, ChinaHungaryIBRD onlyIcelandIDA & IBRD totalIDA blendIDA onlyIDA totalIndiaIndonesiaIran, Islamic Rep.IraqIrelandIsraelItalyJamaicaJapanJordanKazakhstanKenyaKiribatiKorea, Rep.KosovoKuwaitKyrgyz RepublicLao PDRLate-demographic dividendLatin America & Caribbean Latin America & Caribbean (excluding high income)Latin America & the Caribbean (IDA & IBRD countries)LatviaLeast developed countries: UN classificationLebanonLesothoLiberiaLibyaLithuaniaLow & middle incomeLow incomeLower middle incomeLuxembourgMacao SAR, ChinaMacedonia, FYRMadagascarMalawiMalaysiaMaldivesMaliMaltaMauritaniaMauritiusMexicoMicronesia, Fed. Sts.Middle East & North AfricaMiddle East & North Africa (excluding high income)Middle East & North Africa (IDA & IBRD countries)Middle incomeMoldovaMongoliaMontenegroMoroccoMozambiqueNamibiaNepalNetherlandsNew CaledoniaNew ZealandNicaraguaNigerNigeriaNorth AmericaNorwayOECD membersOmanPakistanPanamaPapua New GuineaParaguayPeruPhilippinesPolandPortugalPost-demographic dividendPre-demographic dividendPuerto RicoRomaniaRussian FederationRwandaSaudi ArabiaSenegalSerbiaSeychellesSierra LeoneSingaporeSlovak RepublicSloveniaSolomon IslandsSomaliaSouth AfricaSouth AsiaSouth Asia (IDA & IBRD)South SudanSpainSri LankaSt. Kitts and NevisSt. LuciaSt. Vincent and the GrenadinesSub-Saharan Africa Sub-Saharan Africa (excluding high income)Sub-Saharan Africa (IDA & IBRD countries)SudanSurinameSwazilandSwedenSwitzerlandSyrian Arab RepublicTajikistanTanzaniaThailandTimor-LesteTogoTongaTrinidad and TobagoTunisiaTurkeyTurkmenistanUgandaUkraineUnited Arab EmiratesUnited KingdomUnited StatesUpper middle incomeUruguayUzbekistanVanuatuVenezuela, RBVietnamWest Bank and GazaWorldYemen, Rep.ZambiaZimbabwe Timeline:
This timeline shows a graph from 1981 to 2016 of Mozambique. No data until 1980. Number of actual observations by date: 36.
Source name:
World Development Indicators
Source organization:
World Bank national accounts data, and OECD National Accounts data files.
Categories, topics:
Economy & Growth
Last updated:
apr 23, 2017
Indicators value changes by year
Minimum:
154.12 mln
jan 1, 1986
Maximum:
7.302 bln
jan 1, 2015
At the date of observation
Value
Absolute change
Change from previous value
jan 1, 1981
269.134 mln
+269.134 mln
0.0%
jan 1, 1982
336.554 mln
+67.42 mln
25.05%
jan 1, 1983
411.546 mln
+74.993 mln
22.28%
jan 1, 1984
375.579 mln
-35.968 mln
-8.74%
jan 1, 1985
394.037 mln
+18.458 mln
4.91%
jan 1, 1986
154.12 mln
-239.917 mln
-60.89%
jan 1, 1987
368.412 mln
+214.292 mln
139.04%
jan 1, 1988
400.49 mln
+32.078 mln
8.71%
jan 1, 1989
448.537 mln
+48.046 mln
12.0%
jan 1, 1990
486.089 mln
+37.553 mln
8.37%
jan 1, 1991
554.368 mln
+68.278 mln
14.05%
jan 1, 1992
369.017 mln
-185.351 mln
-33.43%
jan 1, 1993
322.814 mln
-46.202 mln
-12.52%
jan 1, 1994
343.695 mln
+20.88 mln
6.47%
jan 1, 1995
400.86 mln
+57.166 mln
16.63%
jan 1, 1996
502.826 mln
+101.966 mln
25.44%
jan 1, 1997
543.898 mln
+41.072 mln
8.17%
jan 1, 1998
650.651 mln
+106.753 mln
19.63%
jan 1, 1999
657.844 mln
+7.193 mln
1.11%
jan 1, 2000
752.327 mln
+94.483 mln
14.36%
jan 1, 2001
1.107 bln
+354.357 mln
47.1%
jan 1, 2002
675.177 mln
-431.508 mln
-38.99%
jan 1, 2003
1.044 bln
+368.992 mln
54.65%
jan 1, 2004
862.331 mln
-181.837 mln
-17.41%
jan 1, 2005
881.591 mln
+19.26 mln
2.23%
jan 1, 2006
1.02 bln
+138.656 mln
15.73%
jan 1, 2007
1.039 bln
+18.956 mln
1.86%
jan 1, 2008
1.056 bln
+16.348 mln
1.57%
jan 1, 2009
1.744 bln
+688.668 mln
65.24%
jan 1, 2010
1.539 bln
-205.612 mln
-11.79%
jan 1, 2011
1.814 bln
+275.258 mln
17.89%
jan 1, 2012
2.829 bln
+1.015 bln
55.96%
jan 1, 2013
5.106 bln
+2.277 bln
80.47%
jan 1, 2014
6.305 bln
+1.199 bln
23.48%
jan 1, 2015
7.302 bln
+997.486 mln
15.82%
jan 1, 2016
4.572 bln
-2.73 bln
-37.38%
Ranking of countries by current statistics by years


Comments: