29
/
en
AIzaSyAYiBZKx7MnpbEhh9jyipgxe19OcubqV5w
April 1, 2024
231106
Rwanda
RWA
true
2
1
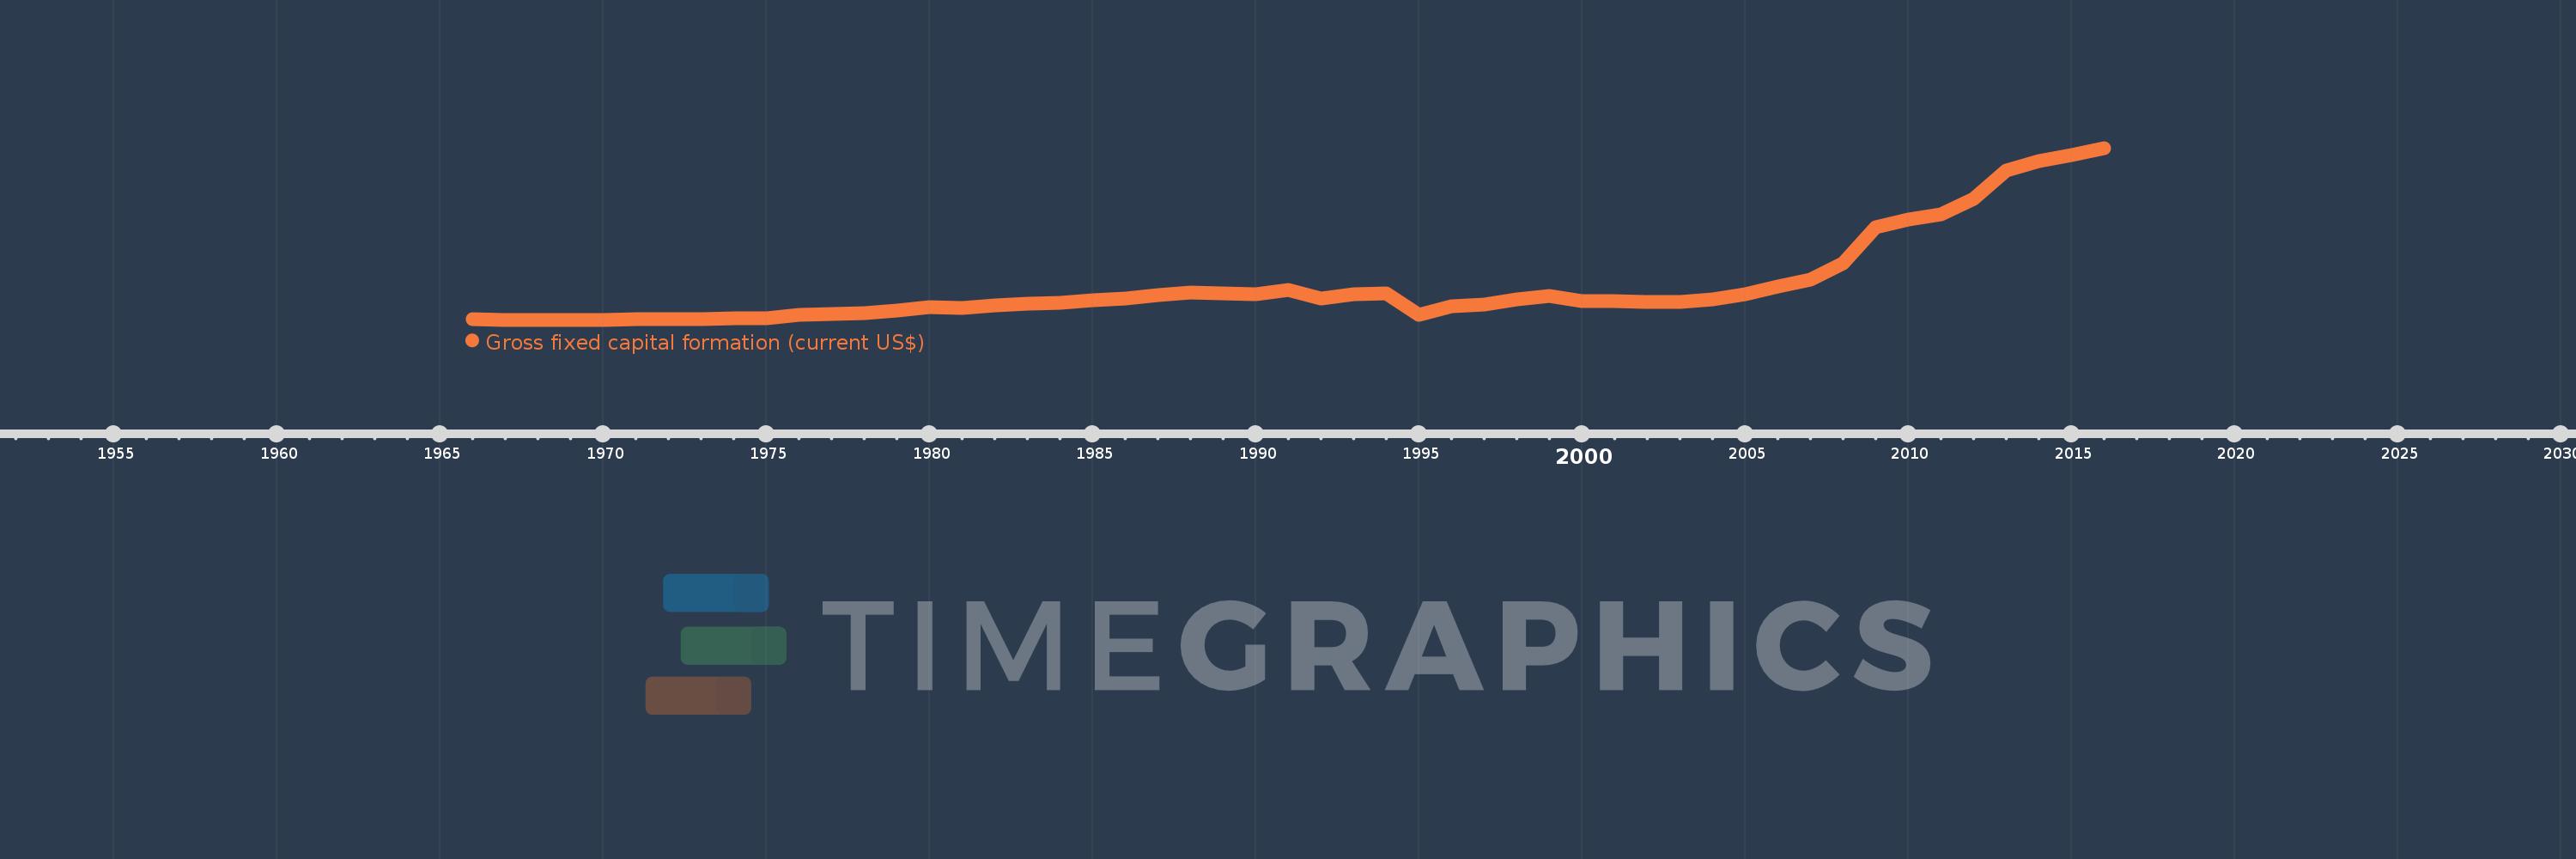
Gross fixed capital formation (current US$)
2016,2015,2014,2013,2012,2011,2010,2009,2008,2007,2006,2005,2004,2003,2002,2001,2000,1999,1998,1997,1996,1995,1994,1993,1992,1991,1990,1989,1988,1987,1986,1985,1984,1983,1982,1981,1980,1979,1978,1977,1976,1975,1974,1973,1972,1971,1970,1969,1968,1967,1966
This statistics in other country:
AfghanistanAlbaniaAlgeriaAngolaAntigua and BarbudaArab WorldArgentinaArmeniaArubaAustraliaAustriaAzerbaijanBahamas, TheBahrainBangladeshBarbadosBelarusBelgiumBelizeBeninBermudaBhutanBoliviaBosnia and HerzegovinaBotswanaBrazilBrunei DarussalamBulgariaBurkina FasoBurundiCabo VerdeCambodiaCameroonCanadaCaribbean small statesCentral African RepublicCentral Europe and the BalticsChadChileChinaColombiaComorosCongo, Dem. Rep.Congo, Rep.Costa RicaCote d'IvoireCroatiaCubaCyprusCzech RepublicDenmarkDjiboutiDominicaDominican RepublicEarly-demographic dividendEast Asia & PacificEast Asia & Pacific (excluding high income)East Asia & Pacific (IDA & IBRD countries)EcuadorEgypt, Arab Rep.El SalvadorEquatorial GuineaEritreaEstoniaEthiopiaEuro areaEurope & Central AsiaEurope & Central Asia (excluding high income)Europe & Central Asia (IDA & IBRD countries)European UnionFijiFinlandFragile and conflict affected situationsFranceGabonGambia, TheGeorgiaGermanyGhanaGreeceGrenadaGuatemalaGuineaGuinea-BissauGuyanaHaitiHeavily indebted poor countries (HIPC)High incomeHondurasHong Kong SAR, ChinaHungaryIBRD onlyIcelandIDA & IBRD totalIDA blendIDA onlyIDA totalIndiaIndonesiaIran, Islamic Rep.IraqIrelandIsraelItalyJamaicaJapanJordanKazakhstanKenyaKiribatiKorea, Rep.KosovoKuwaitKyrgyz RepublicLao PDRLate-demographic dividendLatin America & Caribbean Latin America & Caribbean (excluding high income)Latin America & the Caribbean (IDA & IBRD countries)LatviaLeast developed countries: UN classificationLebanonLesothoLiberiaLibyaLithuaniaLow & middle incomeLow incomeLower middle incomeLuxembourgMacao SAR, ChinaMacedonia, FYRMadagascarMalawiMalaysiaMaldivesMaliMaltaMauritaniaMauritiusMexicoMicronesia, Fed. Sts.Middle East & North AfricaMiddle East & North Africa (excluding high income)Middle East & North Africa (IDA & IBRD countries)Middle incomeMoldovaMongoliaMontenegroMoroccoMozambiqueNamibiaNepalNetherlandsNew CaledoniaNew ZealandNicaraguaNigerNigeriaNorth AmericaNorwayOECD membersOmanPakistanPanamaPapua New GuineaParaguayPeruPhilippinesPolandPortugalPost-demographic dividendPre-demographic dividendPuerto RicoRomaniaRussian FederationRwandaSaudi ArabiaSenegalSerbiaSeychellesSierra LeoneSingaporeSlovak RepublicSloveniaSolomon IslandsSomaliaSouth AfricaSouth AsiaSouth Asia (IDA & IBRD)South SudanSpainSri LankaSt. Kitts and NevisSt. LuciaSt. Vincent and the GrenadinesSub-Saharan Africa Sub-Saharan Africa (excluding high income)Sub-Saharan Africa (IDA & IBRD countries)SudanSurinameSwazilandSwedenSwitzerlandSyrian Arab RepublicTajikistanTanzaniaThailandTimor-LesteTogoTongaTrinidad and TobagoTunisiaTurkeyTurkmenistanUgandaUkraineUnited Arab EmiratesUnited KingdomUnited StatesUpper middle incomeUruguayUzbekistanVanuatuVenezuela, RBVietnamWest Bank and GazaWorldYemen, Rep.ZambiaZimbabwe Timeline:
This timeline shows a graph from 1966 to 2016 of Rwanda. No data until 1965. Number of actual observations by date: 51.
Source name:
World Development Indicators
Source organization:
World Bank national accounts data, and OECD National Accounts data files.
Categories, topics:
Economy & Growth
Last updated:
apr 23, 2017
Indicators value changes by year
Minimum:
11.66 mln
jan 1, 1968
Maximum:
2.081 bln
jan 1, 2016
At the date of observation
Value
Absolute change
Change from previous value
jan 1, 1966
14.6 mln
+14.6 mln
0.0%
jan 1, 1967
12.034 mln
-2.566 mln
-17.57%
jan 1, 1968
11.66 mln
-374.286K
-3.11%
jan 1, 1969
12.2 mln
+540.0K
4.63%
jan 1, 1970
12.7 mln
+500.0K
4.1%
jan 1, 1971
15.8 mln
+3.1 mln
24.41%
jan 1, 1972
20.159 mln
+4.359 mln
27.59%
jan 1, 1973
23.451 mln
+3.292 mln
16.33%
jan 1, 1974
27.406 mln
+3.955 mln
16.86%
jan 1, 1975
32.266 mln
+4.859 mln
17.73%
jan 1, 1976
75.425 mln
+43.159 mln
133.76%
jan 1, 1977
82.361 mln
+6.936 mln
9.2%
jan 1, 1978
95.273 mln
+12.912 mln
15.68%
jan 1, 1979
126.498 mln
+31.225 mln
32.77%
jan 1, 1980
164.608 mln
+38.111 mln
30.13%
jan 1, 1981
153.258 mln
-11.35 mln
-6.9%
jan 1, 1982
183.34 mln
+30.082 mln
19.63%
jan 1, 1983
201.827 mln
+18.486 mln
10.08%
jan 1, 1984
215.82 mln
+13.993 mln
6.93%
jan 1, 1985
246.047 mln
+30.227 mln
14.01%
jan 1, 1986
267.145 mln
+21.098 mln
8.57%
jan 1, 1987
305.979 mln
+38.834 mln
14.54%
jan 1, 1988
338.847 mln
+32.868 mln
10.74%
jan 1, 1989
334.176 mln
-4.671 mln
-1.38%
jan 1, 1990
321.114 mln
-13.062 mln
-3.91%
jan 1, 1991
373.602 mln
+52.487 mln
16.35%
jan 1, 1992
268.04 mln
-105.562 mln
-28.26%
jan 1, 1993
317.22 mln
+49.18 mln
18.35%
jan 1, 1994
330.172 mln
+12.952 mln
4.08%
jan 1, 1995
75.232 mln
-254.94 mln
-77.21%
jan 1, 1996
173.452 mln
+98.22 mln
130.56%
jan 1, 1997
198.647 mln
+25.196 mln
14.53%
jan 1, 1998
255.696 mln
+57.049 mln
28.72%
jan 1, 1999
294.575 mln
+38.879 mln
15.21%
jan 1, 2000
238.999 mln
-55.576 mln
-18.87%
jan 1, 2001
232.065 mln
-6.934 mln
-2.9%
jan 1, 2002
230.027 mln
-2.038 mln
-0.88%
jan 1, 2003
226.142 mln
-3.885 mln
-1.69%
jan 1, 2004
255.74 mln
+29.598 mln
13.09%
jan 1, 2005
313.967 mln
+58.227 mln
22.77%
jan 1, 2006
406.939 mln
+92.972 mln
29.61%
jan 1, 2007
498.45 mln
+91.511 mln
22.49%
jan 1, 2008
689.271 mln
+190.821 mln
38.28%
jan 1, 2009
1.126 bln
+437.184 mln
63.43%
jan 1, 2010
1.219 bln
+93.012 mln
8.26%
jan 1, 2011
1.283 bln
+63.264 mln
5.19%
jan 1, 2012
1.464 bln
+181.521 mln
14.15%
jan 1, 2013
1.809 bln
+344.325 mln
23.52%
jan 1, 2014
1.921 bln
+112.133 mln
6.2%
jan 1, 2015
1.993 bln
+72.363 mln
3.77%
jan 1, 2016
2.081 bln
+87.443 mln
4.39%
Ranking of countries by current statistics by years


Comments: