29
/
en
AIzaSyAYiBZKx7MnpbEhh9jyipgxe19OcubqV5w
April 1, 2024
133207
Finland
FIN
true
2
1
Gross fixed capital formation (current US$)
2016,2015,2014,2013,2012,2011,2010,2009,2008,2007,2006,2005,2004,2003,2002,2001,2000,1999,1998,1997,1996,1995,1994,1993,1992,1991,1990,1989,1988,1987,1986,1985,1984,1983,1982,1981,1980,1979,1978,1977,1976,1975,1974,1973,1972,1971,1970,1969,1968,1967,1966,1965,1964,1963,1962,1961
This statistics in other country:
AfghanistanAlbaniaAlgeriaAngolaAntigua and BarbudaArab WorldArgentinaArmeniaArubaAustraliaAustriaAzerbaijanBahamas, TheBahrainBangladeshBarbadosBelarusBelgiumBelizeBeninBermudaBhutanBoliviaBosnia and HerzegovinaBotswanaBrazilBrunei DarussalamBulgariaBurkina FasoBurundiCabo VerdeCambodiaCameroonCanadaCaribbean small statesCentral African RepublicCentral Europe and the BalticsChadChileChinaColombiaComorosCongo, Dem. Rep.Congo, Rep.Costa RicaCote d'IvoireCroatiaCubaCyprusCzech RepublicDenmarkDjiboutiDominicaDominican RepublicEarly-demographic dividendEast Asia & PacificEast Asia & Pacific (excluding high income)East Asia & Pacific (IDA & IBRD countries)EcuadorEgypt, Arab Rep.El SalvadorEquatorial GuineaEritreaEstoniaEthiopiaEuro areaEurope & Central AsiaEurope & Central Asia (excluding high income)Europe & Central Asia (IDA & IBRD countries)European UnionFijiFinlandFragile and conflict affected situationsFranceGabonGambia, TheGeorgiaGermanyGhanaGreeceGrenadaGuatemalaGuineaGuinea-BissauGuyanaHaitiHeavily indebted poor countries (HIPC)High incomeHondurasHong Kong SAR, ChinaHungaryIBRD onlyIcelandIDA & IBRD totalIDA blendIDA onlyIDA totalIndiaIndonesiaIran, Islamic Rep.IraqIrelandIsraelItalyJamaicaJapanJordanKazakhstanKenyaKiribatiKorea, Rep.KosovoKuwaitKyrgyz RepublicLao PDRLate-demographic dividendLatin America & Caribbean Latin America & Caribbean (excluding high income)Latin America & the Caribbean (IDA & IBRD countries)LatviaLeast developed countries: UN classificationLebanonLesothoLiberiaLibyaLithuaniaLow & middle incomeLow incomeLower middle incomeLuxembourgMacao SAR, ChinaMacedonia, FYRMadagascarMalawiMalaysiaMaldivesMaliMaltaMauritaniaMauritiusMexicoMicronesia, Fed. Sts.Middle East & North AfricaMiddle East & North Africa (excluding high income)Middle East & North Africa (IDA & IBRD countries)Middle incomeMoldovaMongoliaMontenegroMoroccoMozambiqueNamibiaNepalNetherlandsNew CaledoniaNew ZealandNicaraguaNigerNigeriaNorth AmericaNorwayOECD membersOmanPakistanPanamaPapua New GuineaParaguayPeruPhilippinesPolandPortugalPost-demographic dividendPre-demographic dividendPuerto RicoRomaniaRussian FederationRwandaSaudi ArabiaSenegalSerbiaSeychellesSierra LeoneSingaporeSlovak RepublicSloveniaSolomon IslandsSomaliaSouth AfricaSouth AsiaSouth Asia (IDA & IBRD)South SudanSpainSri LankaSt. Kitts and NevisSt. LuciaSt. Vincent and the GrenadinesSub-Saharan Africa Sub-Saharan Africa (excluding high income)Sub-Saharan Africa (IDA & IBRD countries)SudanSurinameSwazilandSwedenSwitzerlandSyrian Arab RepublicTajikistanTanzaniaThailandTimor-LesteTogoTongaTrinidad and TobagoTunisiaTurkeyTurkmenistanUgandaUkraineUnited Arab EmiratesUnited KingdomUnited StatesUpper middle incomeUruguayUzbekistanVanuatuVenezuela, RBVietnamWest Bank and GazaWorldYemen, Rep.ZambiaZimbabwe Timeline:
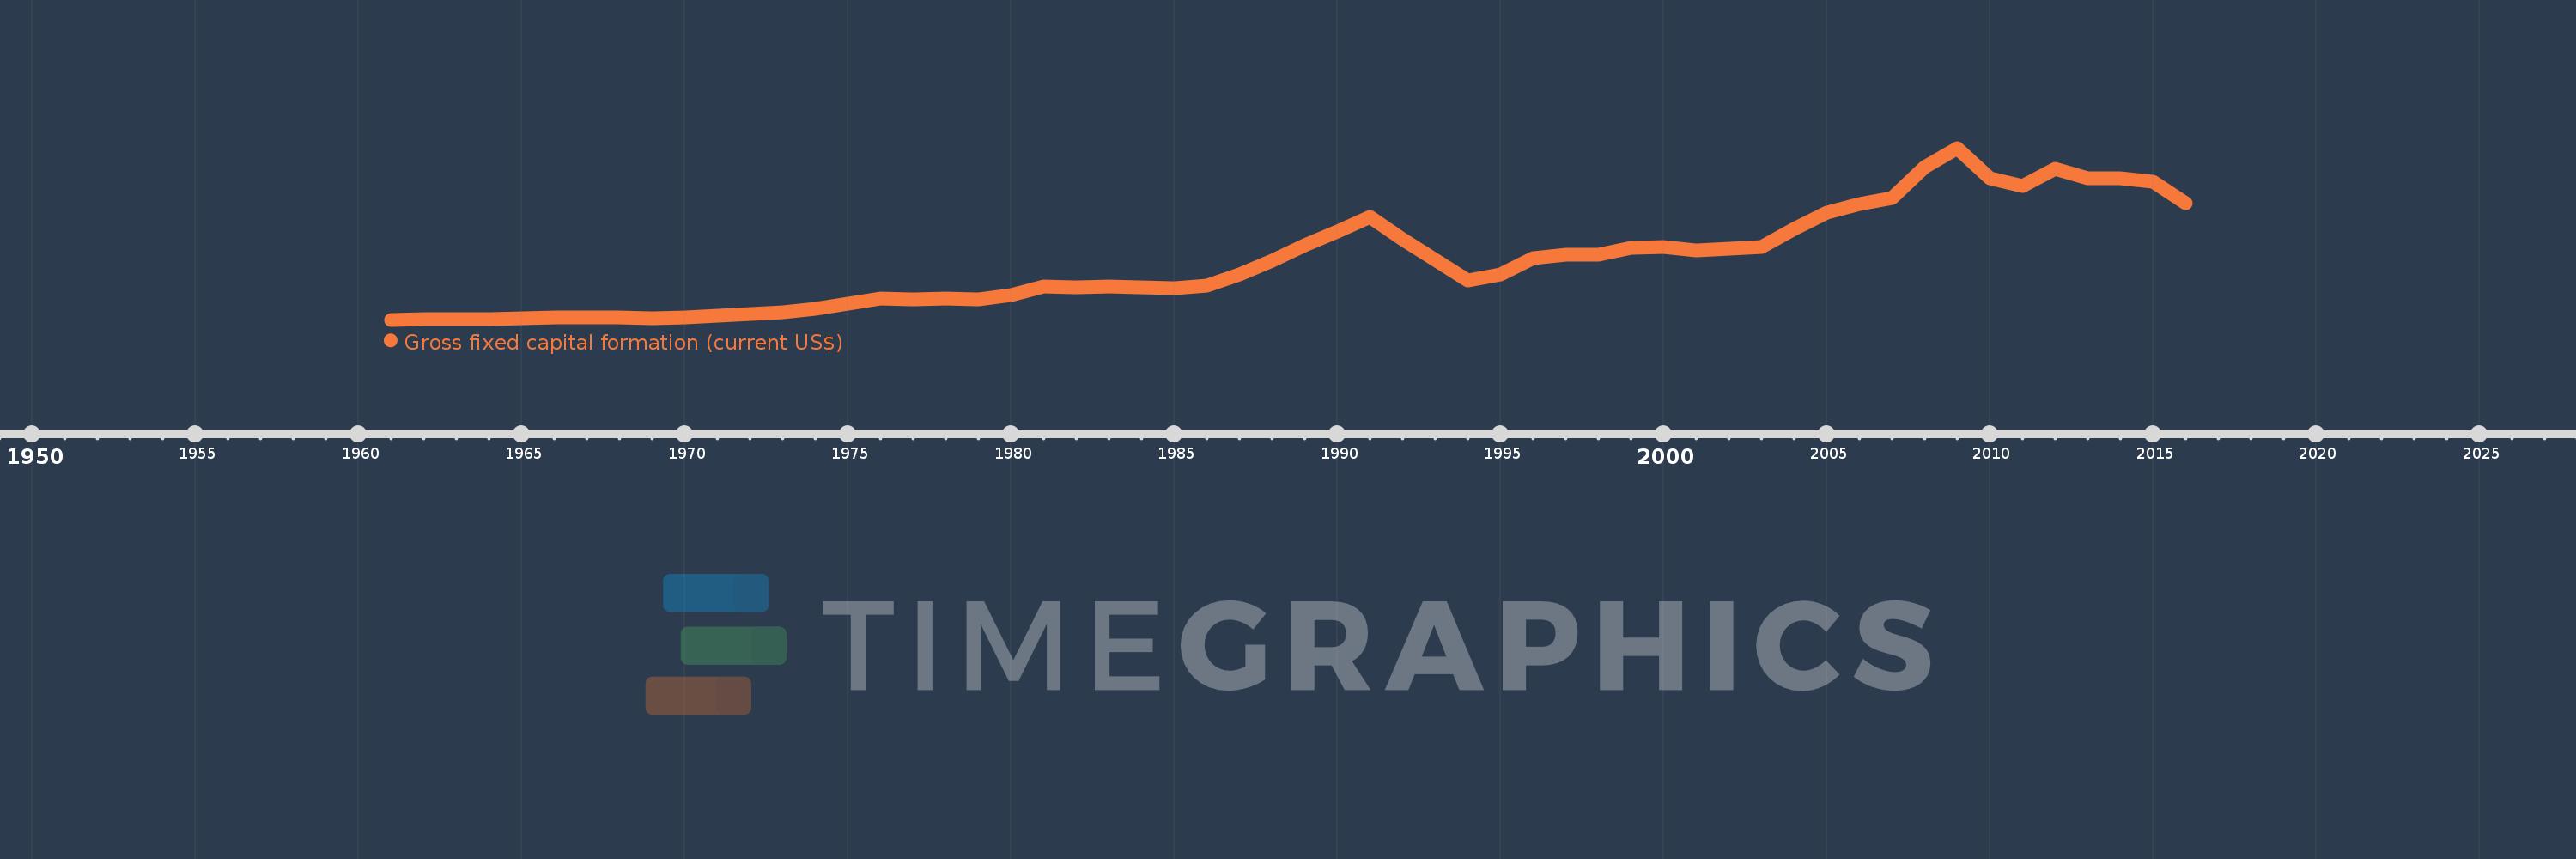
This timeline shows a graph from 1961 to 2016 of Finland. No data until 1960. Number of actual observations by date: 56.
Source name:
World Development Indicators
Source organization:
World Bank national accounts data, and OECD National Accounts data files.
Categories, topics:
Economy & Growth
Last updated:
apr 23, 2017
Indicators value changes by year
Minimum:
1.512 bln
jan 1, 1961
Maximum:
69.203 bln
jan 1, 2009
At the date of observation
Value
Absolute change
Change from previous value
jan 1, 1961
1.512 bln
+1.512 bln
0.0%
jan 1, 1962
1.692 bln
+179.288 mln
11.85%
jan 1, 1963
1.786 bln
+94.258 mln
5.57%
jan 1, 1964
1.8 bln
+13.842 mln
0.78%
jan 1, 1965
2.0 bln
+200.051 mln
11.12%
jan 1, 1966
2.312 bln
+312.436 mln
15.62%
jan 1, 1967
2.491 bln
+178.956 mln
7.74%
jan 1, 1968
2.403 bln
-87.895 mln
-3.53%
jan 1, 1969
2.082 bln
-321.686 mln
-13.38%
jan 1, 1970
2.453 bln
+371.144 mln
17.83%
jan 1, 1971
3.17 bln
+717.32 mln
29.24%
jan 1, 1972
3.661 bln
+491.026 mln
15.49%
jan 1, 1973
4.376 bln
+714.987 mln
19.53%
jan 1, 1974
5.968 bln
+1.592 bln
36.38%
jan 1, 1975
7.898 bln
+1.93 bln
32.34%
jan 1, 1976
9.866 bln
+1.968 bln
24.92%
jan 1, 1977
9.526 bln
-340.753 mln
-3.45%
jan 1, 1978
9.78 bln
+254.302 mln
2.67%
jan 1, 1979
9.387 bln
-393.074 mln
-4.02%
jan 1, 1980
11.212 bln
+1.826 bln
19.45%
jan 1, 1981
14.656 bln
+3.443 bln
30.71%
jan 1, 1982
14.226 bln
-430.04 mln
-2.93%
jan 1, 1983
14.475 bln
+249.463 mln
1.75%
jan 1, 1984
14.167 bln
-307.767 mln
-2.13%
jan 1, 1985
13.921 bln
-246.721 mln
-1.74%
jan 1, 1986
14.892 bln
+970.939 mln
6.97%
jan 1, 1987
19.215 bln
+4.324 bln
29.03%
jan 1, 1988
24.653 bln
+5.438 bln
28.3%
jan 1, 1989
30.724 bln
+6.07 bln
24.62%
jan 1, 1990
36.364 bln
+5.641 bln
18.36%
jan 1, 1991
41.973 bln
+5.609 bln
15.42%
jan 1, 1992
33.058 bln
-8.915 bln
-21.24%
jan 1, 1993
25.008 bln
-8.05 bln
-24.35%
jan 1, 1994
17.082 bln
-7.926 bln
-31.69%
jan 1, 1995
19.265 bln
+2.182 bln
12.78%
jan 1, 1996
25.866 bln
+6.601 bln
34.27%
jan 1, 1997
27.088 bln
+1.222 bln
4.72%
jan 1, 1998
27.108 bln
+20.25 mln
0.07%
jan 1, 1999
29.767 bln
+2.659 bln
9.81%
jan 1, 2000
30.345 bln
+577.727 mln
1.94%
jan 1, 2001
28.982 bln
-1.363 bln
-4.49%
jan 1, 2002
29.602 bln
+619.848 mln
2.14%
jan 1, 2003
30.182 bln
+579.84 mln
1.96%
jan 1, 2004
37.305 bln
+7.123 bln
23.6%
jan 1, 2005
43.87 bln
+6.565 bln
17.6%
jan 1, 2006
46.933 bln
+3.063 bln
6.98%
jan 1, 2007
49.346 bln
+2.413 bln
5.14%
jan 1, 2008
61.734 bln
+12.388 bln
25.1%
jan 1, 2009
69.203 bln
+7.469 bln
12.1%
jan 1, 2010
57.22 bln
-11.983 bln
-17.32%
jan 1, 2011
54.216 bln
-3.004 bln
-5.25%
jan 1, 2012
60.855 bln
+6.639 bln
12.25%
jan 1, 2013
57.318 bln
-3.537 bln
-5.81%
jan 1, 2014
57.203 bln
-114.654 mln
-0.2%
jan 1, 2015
56.051 bln
-1.153 bln
-2.01%
jan 1, 2016
47.375 bln
-8.676 bln
-15.48%
Ranking of countries by current statistics by years


Comments: