29
/
en
AIzaSyAYiBZKx7MnpbEhh9jyipgxe19OcubqV5w
April 1, 2024
31632
Europe & Central Asia (excluding high income)
ECA
false
2
1
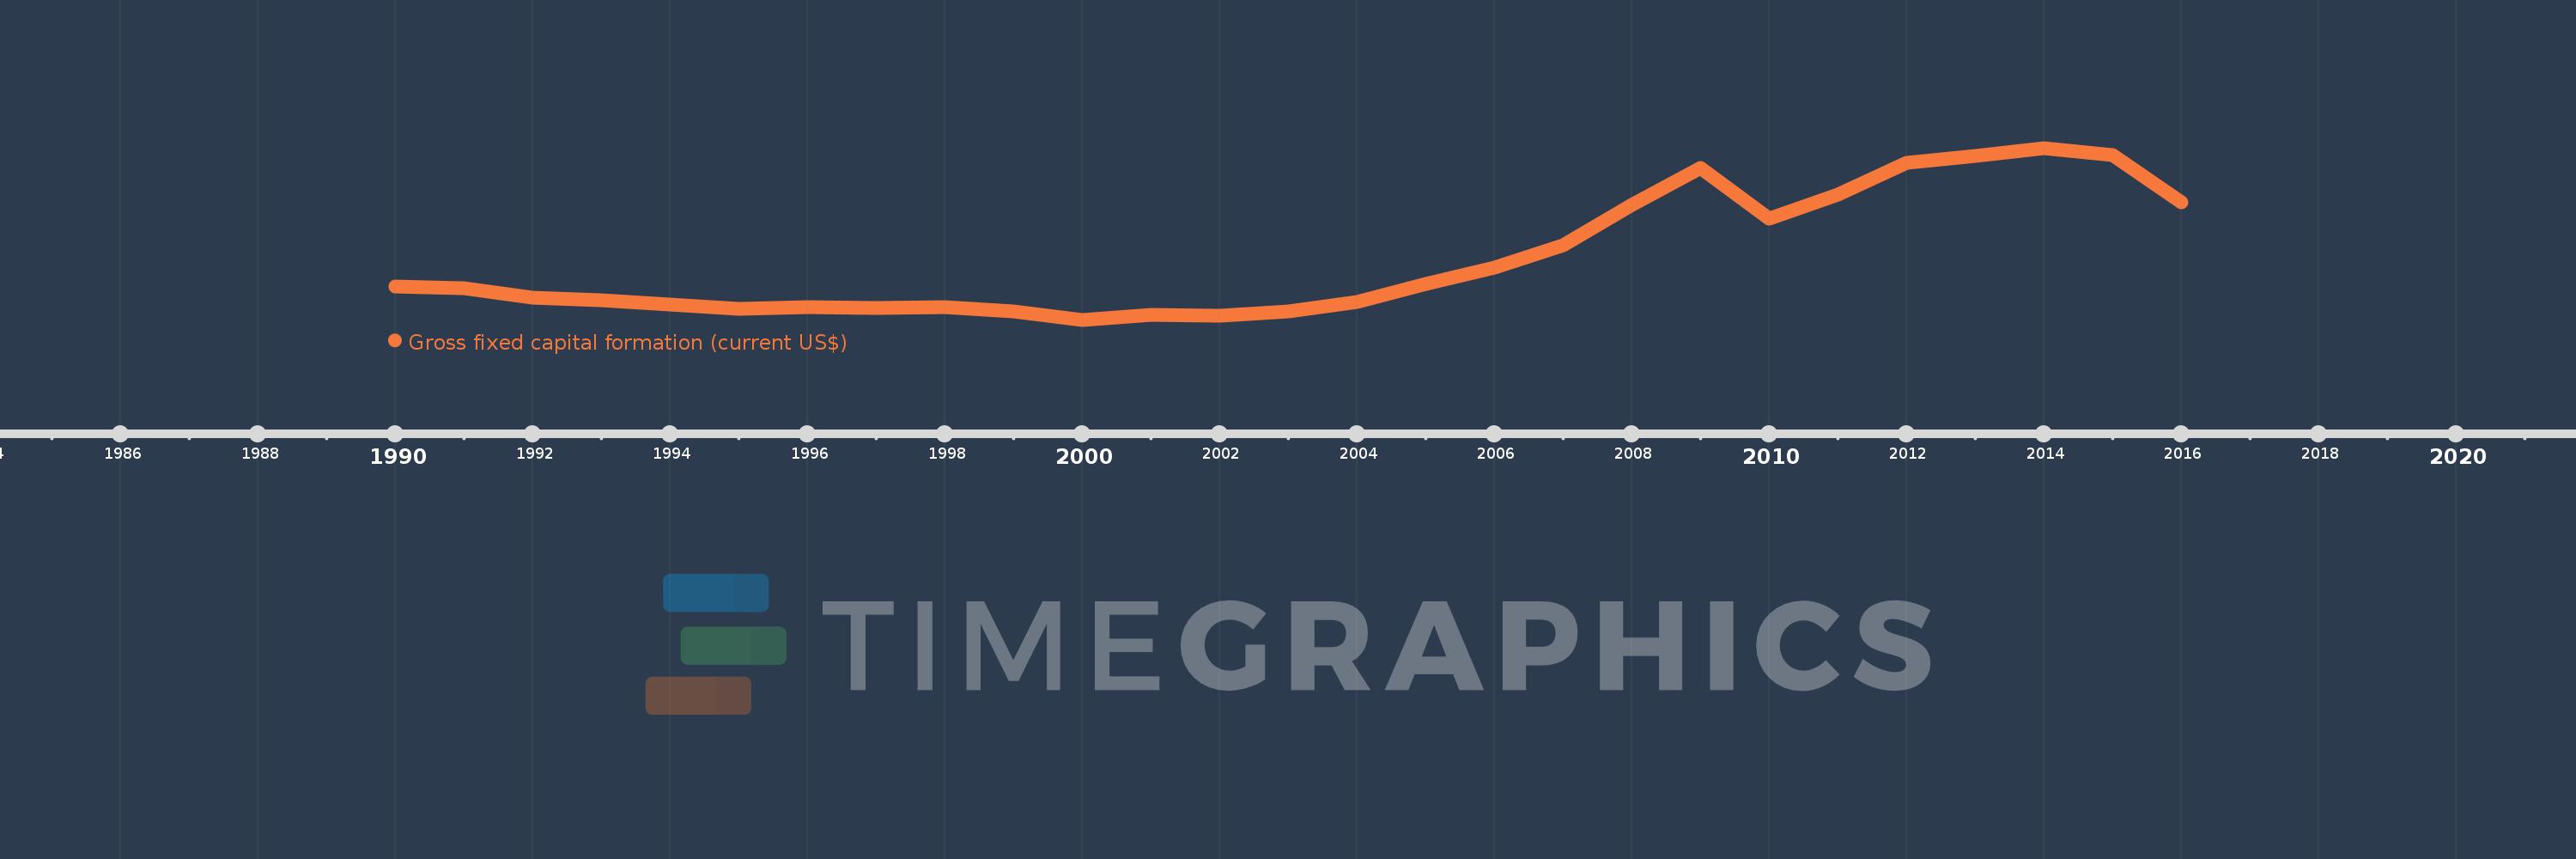
Gross fixed capital formation (current US$)
2016,2015,2014,2013,2012,2011,2010,2009,2008,2007,2006,2005,2004,2003,2002,2001,2000,1999,1998,1997,1996,1995,1994,1993,1992,1991,1990
This statistics in other country:
AfghanistanAlbaniaAlgeriaAngolaAntigua and BarbudaArab WorldArgentinaArmeniaArubaAustraliaAustriaAzerbaijanBahamas, TheBahrainBangladeshBarbadosBelarusBelgiumBelizeBeninBermudaBhutanBoliviaBosnia and HerzegovinaBotswanaBrazilBrunei DarussalamBulgariaBurkina FasoBurundiCabo VerdeCambodiaCameroonCanadaCaribbean small statesCentral African RepublicCentral Europe and the BalticsChadChileChinaColombiaComorosCongo, Dem. Rep.Congo, Rep.Costa RicaCote d'IvoireCroatiaCubaCyprusCzech RepublicDenmarkDjiboutiDominicaDominican RepublicEarly-demographic dividendEast Asia & PacificEast Asia & Pacific (excluding high income)East Asia & Pacific (IDA & IBRD countries)EcuadorEgypt, Arab Rep.El SalvadorEquatorial GuineaEritreaEstoniaEthiopiaEuro areaEurope & Central AsiaEurope & Central Asia (excluding high income)Europe & Central Asia (IDA & IBRD countries)European UnionFijiFinlandFragile and conflict affected situationsFranceGabonGambia, TheGeorgiaGermanyGhanaGreeceGrenadaGuatemalaGuineaGuinea-BissauGuyanaHaitiHeavily indebted poor countries (HIPC)High incomeHondurasHong Kong SAR, ChinaHungaryIBRD onlyIcelandIDA & IBRD totalIDA blendIDA onlyIDA totalIndiaIndonesiaIran, Islamic Rep.IraqIrelandIsraelItalyJamaicaJapanJordanKazakhstanKenyaKiribatiKorea, Rep.KosovoKuwaitKyrgyz RepublicLao PDRLate-demographic dividendLatin America & Caribbean Latin America & Caribbean (excluding high income)Latin America & the Caribbean (IDA & IBRD countries)LatviaLeast developed countries: UN classificationLebanonLesothoLiberiaLibyaLithuaniaLow & middle incomeLow incomeLower middle incomeLuxembourgMacao SAR, ChinaMacedonia, FYRMadagascarMalawiMalaysiaMaldivesMaliMaltaMauritaniaMauritiusMexicoMicronesia, Fed. Sts.Middle East & North AfricaMiddle East & North Africa (excluding high income)Middle East & North Africa (IDA & IBRD countries)Middle incomeMoldovaMongoliaMontenegroMoroccoMozambiqueNamibiaNepalNetherlandsNew CaledoniaNew ZealandNicaraguaNigerNigeriaNorth AmericaNorwayOECD membersOmanPakistanPanamaPapua New GuineaParaguayPeruPhilippinesPolandPortugalPost-demographic dividendPre-demographic dividendPuerto RicoRomaniaRussian FederationRwandaSaudi ArabiaSenegalSerbiaSeychellesSierra LeoneSingaporeSlovak RepublicSloveniaSolomon IslandsSomaliaSouth AfricaSouth AsiaSouth Asia (IDA & IBRD)South SudanSpainSri LankaSt. Kitts and NevisSt. LuciaSt. Vincent and the GrenadinesSub-Saharan Africa Sub-Saharan Africa (excluding high income)Sub-Saharan Africa (IDA & IBRD countries)SudanSurinameSwazilandSwedenSwitzerlandSyrian Arab RepublicTajikistanTanzaniaThailandTimor-LesteTogoTongaTrinidad and TobagoTunisiaTurkeyTurkmenistanUgandaUkraineUnited Arab EmiratesUnited KingdomUnited StatesUpper middle incomeUruguayUzbekistanVanuatuVenezuela, RBVietnamWest Bank and GazaWorldYemen, Rep.ZambiaZimbabwe Timeline:
This timeline shows a graph from 1990 to 2016 of Europe & Central Asia (excluding high income). No data until 1989. Number of actual observations by date: 27.
Source name:
World Development Indicators
Source organization:
World Bank national accounts data, and OECD National Accounts data files.
Categories, topics:
Economy & Growth
Last updated:
apr 23, 2017
Indicators value changes by year
Minimum:
109.914 bln
jan 1, 2000
Maximum:
867.649 bln
jan 1, 2014
At the date of observation
Value
Absolute change
Change from previous value
jan 1, 1990
255.994 bln
+255.994 bln
0.0%
jan 1, 1991
250.682 bln
-5.312 bln
-2.08%
jan 1, 1992
208.082 bln
-42.6 bln
-16.99%
jan 1, 1993
195.291 bln
-12.791 bln
-6.15%
jan 1, 1994
178.552 bln
-16.739 bln
-8.57%
jan 1, 1995
157.725 bln
-20.827 bln
-11.66%
jan 1, 1996
163.867 bln
+6.142 bln
3.89%
jan 1, 1997
162.55 bln
-1.318 bln
-0.8%
jan 1, 1998
164.88 bln
+2.33 bln
1.43%
jan 1, 1999
145.688 bln
-19.192 bln
-11.64%
jan 1, 2000
109.914 bln
-35.775 bln
-24.56%
jan 1, 2001
131.513 bln
+21.599 bln
19.65%
jan 1, 2002
128.81 bln
-2.703 bln
-2.06%
jan 1, 2003
145.477 bln
+16.667 bln
12.94%
jan 1, 2004
189.32 bln
+43.843 bln
30.14%
jan 1, 2005
266.63 bln
+77.31 bln
40.84%
jan 1, 2006
340.464 bln
+73.834 bln
27.69%
jan 1, 2007
439.313 bln
+98.849 bln
29.03%
jan 1, 2008
615.484 bln
+176.171 bln
40.1%
jan 1, 2009
778.253 bln
+162.769 bln
26.45%
jan 1, 2010
556.921 bln
-221.331 bln
-28.44%
jan 1, 2011
661.948 bln
+105.026 bln
18.86%
jan 1, 2012
800.927 bln
+138.979 bln
21.0%
jan 1, 2013
830.61 bln
+29.684 bln
3.71%
jan 1, 2014
867.649 bln
+37.038 bln
4.46%
jan 1, 2015
835.031 bln
-32.617 bln
-3.76%
jan 1, 2016
627.193 bln
-207.839 bln
-24.89%
Ranking of countries by current statistics by years


Comments: