29
/
en
AIzaSyAYiBZKx7MnpbEhh9jyipgxe19OcubqV5w
April 1, 2024
75062
Azerbaijan
AZE
true
2
1
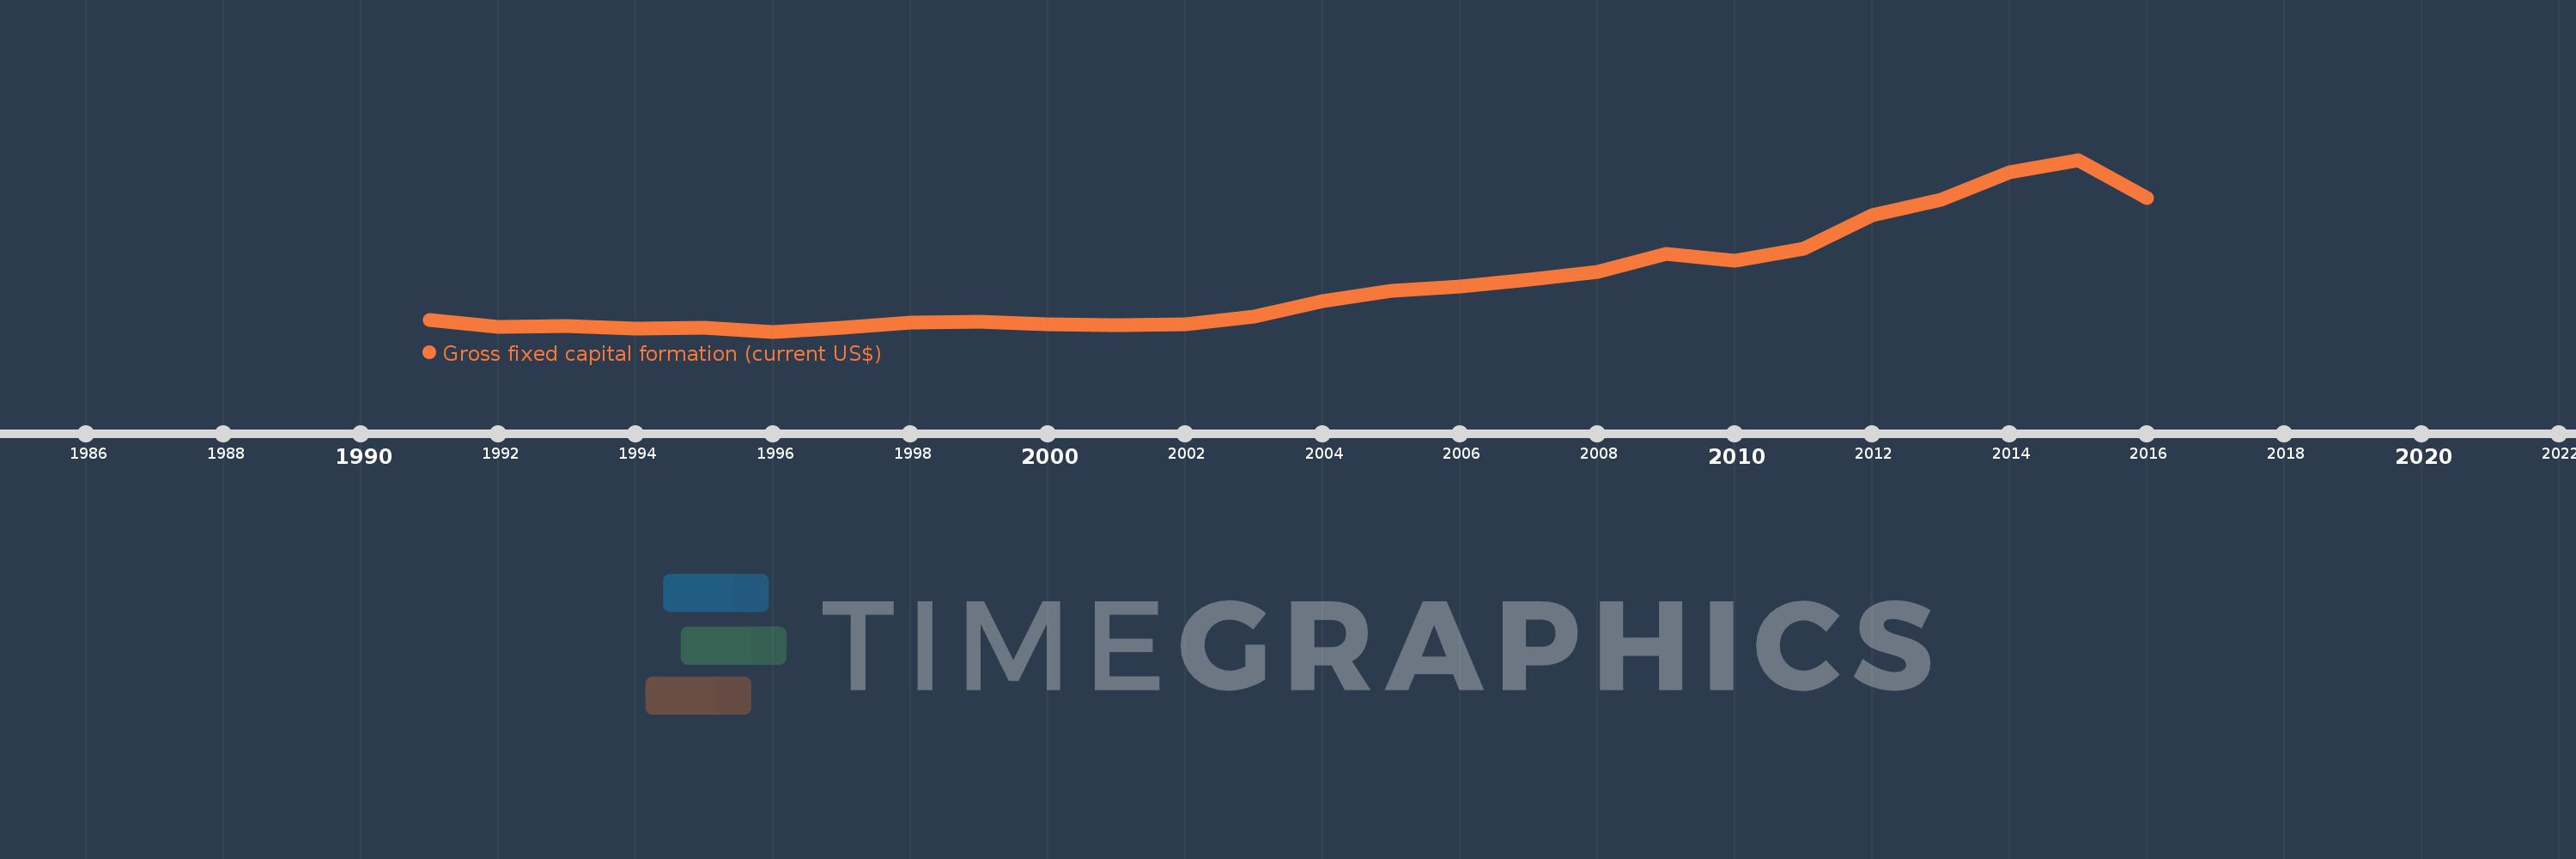
Gross fixed capital formation (current US$)
2016,2015,2014,2013,2012,2011,2010,2009,2008,2007,2006,2005,2004,2003,2002,2001,2000,1999,1998,1997,1996,1995,1994,1993,1992,1991
This statistics in other country:
AfghanistanAlbaniaAlgeriaAngolaAntigua and BarbudaArab WorldArgentinaArmeniaArubaAustraliaAustriaAzerbaijanBahamas, TheBahrainBangladeshBarbadosBelarusBelgiumBelizeBeninBermudaBhutanBoliviaBosnia and HerzegovinaBotswanaBrazilBrunei DarussalamBulgariaBurkina FasoBurundiCabo VerdeCambodiaCameroonCanadaCaribbean small statesCentral African RepublicCentral Europe and the BalticsChadChileChinaColombiaComorosCongo, Dem. Rep.Congo, Rep.Costa RicaCote d'IvoireCroatiaCubaCyprusCzech RepublicDenmarkDjiboutiDominicaDominican RepublicEarly-demographic dividendEast Asia & PacificEast Asia & Pacific (excluding high income)East Asia & Pacific (IDA & IBRD countries)EcuadorEgypt, Arab Rep.El SalvadorEquatorial GuineaEritreaEstoniaEthiopiaEuro areaEurope & Central AsiaEurope & Central Asia (excluding high income)Europe & Central Asia (IDA & IBRD countries)European UnionFijiFinlandFragile and conflict affected situationsFranceGabonGambia, TheGeorgiaGermanyGhanaGreeceGrenadaGuatemalaGuineaGuinea-BissauGuyanaHaitiHeavily indebted poor countries (HIPC)High incomeHondurasHong Kong SAR, ChinaHungaryIBRD onlyIcelandIDA & IBRD totalIDA blendIDA onlyIDA totalIndiaIndonesiaIran, Islamic Rep.IraqIrelandIsraelItalyJamaicaJapanJordanKazakhstanKenyaKiribatiKorea, Rep.KosovoKuwaitKyrgyz RepublicLao PDRLate-demographic dividendLatin America & Caribbean Latin America & Caribbean (excluding high income)Latin America & the Caribbean (IDA & IBRD countries)LatviaLeast developed countries: UN classificationLebanonLesothoLiberiaLibyaLithuaniaLow & middle incomeLow incomeLower middle incomeLuxembourgMacao SAR, ChinaMacedonia, FYRMadagascarMalawiMalaysiaMaldivesMaliMaltaMauritaniaMauritiusMexicoMicronesia, Fed. Sts.Middle East & North AfricaMiddle East & North Africa (excluding high income)Middle East & North Africa (IDA & IBRD countries)Middle incomeMoldovaMongoliaMontenegroMoroccoMozambiqueNamibiaNepalNetherlandsNew CaledoniaNew ZealandNicaraguaNigerNigeriaNorth AmericaNorwayOECD membersOmanPakistanPanamaPapua New GuineaParaguayPeruPhilippinesPolandPortugalPost-demographic dividendPre-demographic dividendPuerto RicoRomaniaRussian FederationRwandaSaudi ArabiaSenegalSerbiaSeychellesSierra LeoneSingaporeSlovak RepublicSloveniaSolomon IslandsSomaliaSouth AfricaSouth AsiaSouth Asia (IDA & IBRD)South SudanSpainSri LankaSt. Kitts and NevisSt. LuciaSt. Vincent and the GrenadinesSub-Saharan Africa Sub-Saharan Africa (excluding high income)Sub-Saharan Africa (IDA & IBRD countries)SudanSurinameSwazilandSwedenSwitzerlandSyrian Arab RepublicTajikistanTanzaniaThailandTimor-LesteTogoTongaTrinidad and TobagoTunisiaTurkeyTurkmenistanUgandaUkraineUnited Arab EmiratesUnited KingdomUnited StatesUpper middle incomeUruguayUzbekistanVanuatuVenezuela, RBVietnamWest Bank and GazaWorldYemen, Rep.ZambiaZimbabwe Timeline:
This timeline shows a graph from 1991 to 2016 of Azerbaijan. No data until 1990. Number of actual observations by date: 26.
Source name:
World Development Indicators
Source organization:
World Bank national accounts data, and OECD National Accounts data files.
Categories, topics:
Economy & Growth
Last updated:
apr 23, 2017
Indicators value changes by year
Minimum:
477.511 mln
jan 1, 1996
Maximum:
19.429 bln
jan 1, 2015
At the date of observation
Value
Absolute change
Change from previous value
jan 1, 1991
1.795 bln
+1.795 bln
0.0%
jan 1, 1992
1.007 bln
-787.652 mln
-43.89%
jan 1, 1993
1.089 bln
+82.052 mln
8.15%
jan 1, 1994
832.066 mln
-256.895 mln
-23.59%
jan 1, 1995
870.198 mln
+38.131 mln
4.58%
jan 1, 1996
477.511 mln
-392.687 mln
-45.13%
jan 1, 1997
924.622 mln
+447.111 mln
93.63%
jan 1, 1998
1.466 bln
+541.2 mln
58.53%
jan 1, 1999
1.579 bln
+113.295 mln
7.73%
jan 1, 2000
1.306 bln
-272.98 mln
-17.29%
jan 1, 2001
1.22 bln
-86.219 mln
-6.6%
jan 1, 2002
1.306 bln
+86.04 mln
7.05%
jan 1, 2003
2.125 bln
+819.26 mln
62.73%
jan 1, 2004
3.847 bln
+1.722 bln
81.04%
jan 1, 2005
5.009 bln
+1.162 bln
30.2%
jan 1, 2006
5.472 bln
+462.085 mln
9.22%
jan 1, 2007
6.232 bln
+760.616 mln
13.9%
jan 1, 2008
7.073 bln
+840.455 mln
13.49%
jan 1, 2009
9.076 bln
+2.004 bln
28.33%
jan 1, 2010
8.335 bln
-740.786 mln
-8.16%
jan 1, 2011
9.611 bln
+1.275 bln
15.3%
jan 1, 2012
13.307 bln
+3.697 bln
38.47%
jan 1, 2013
15.018 bln
+1.71 bln
12.85%
jan 1, 2014
18.074 bln
+3.056 bln
20.35%
jan 1, 2015
19.429 bln
+1.354 bln
7.49%
jan 1, 2016
15.17 bln
-4.259 bln
-21.92%
Ranking of countries by current statistics by years


Comments: