29
/
en
AIzaSyAYiBZKx7MnpbEhh9jyipgxe19OcubqV5w
April 1, 2024
238321
Seychelles
SYC
true
2
1
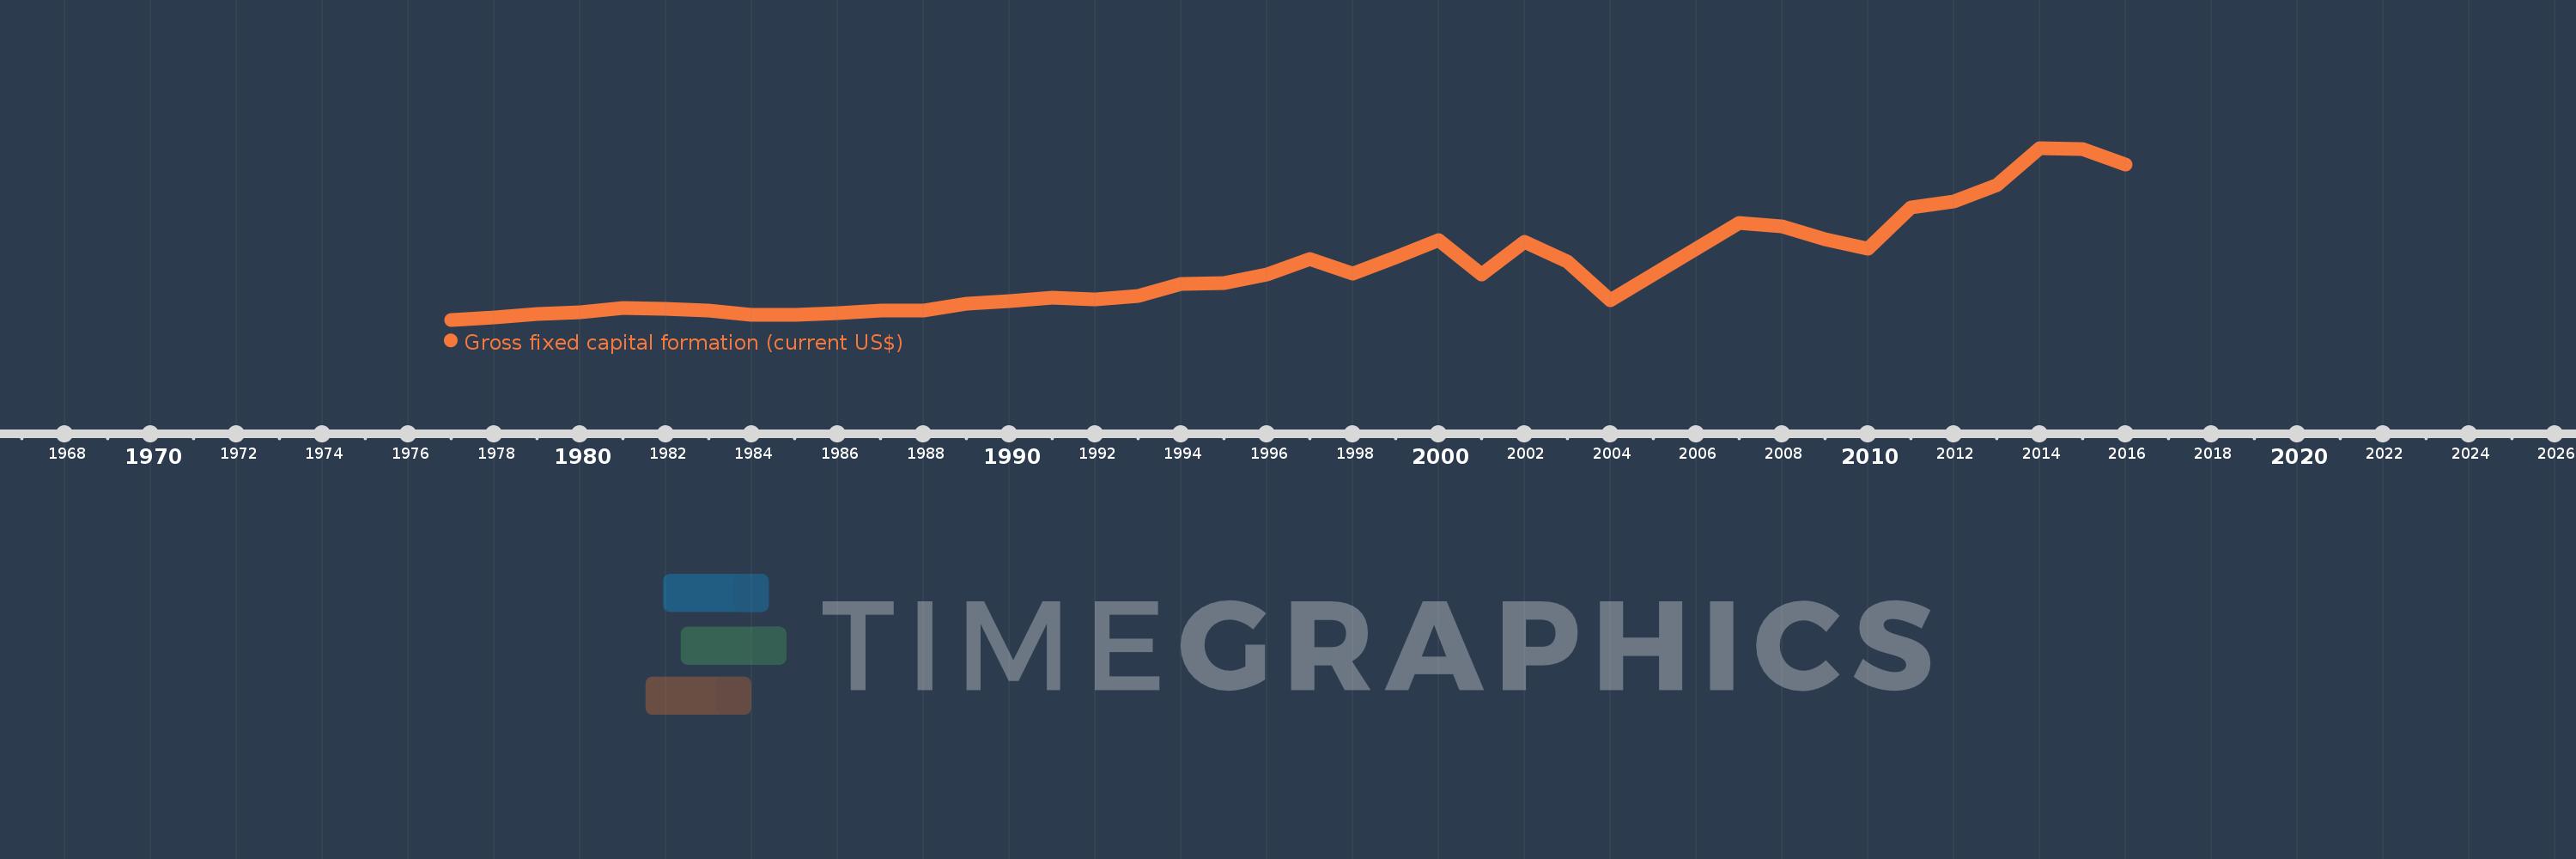
Gross fixed capital formation (current US$)
2016,2015,2014,2013,2012,2011,2010,2009,2008,2007,2004,2003,2002,2001,2000,1999,1998,1997,1996,1995,1994,1993,1992,1991,1990,1989,1988,1987,1986,1985,1984,1983,1982,1981,1980,1979,1978,1977
This statistics in other country:
AfghanistanAlbaniaAlgeriaAngolaAntigua and BarbudaArab WorldArgentinaArmeniaArubaAustraliaAustriaAzerbaijanBahamas, TheBahrainBangladeshBarbadosBelarusBelgiumBelizeBeninBermudaBhutanBoliviaBosnia and HerzegovinaBotswanaBrazilBrunei DarussalamBulgariaBurkina FasoBurundiCabo VerdeCambodiaCameroonCanadaCaribbean small statesCentral African RepublicCentral Europe and the BalticsChadChileChinaColombiaComorosCongo, Dem. Rep.Congo, Rep.Costa RicaCote d'IvoireCroatiaCubaCyprusCzech RepublicDenmarkDjiboutiDominicaDominican RepublicEarly-demographic dividendEast Asia & PacificEast Asia & Pacific (excluding high income)East Asia & Pacific (IDA & IBRD countries)EcuadorEgypt, Arab Rep.El SalvadorEquatorial GuineaEritreaEstoniaEthiopiaEuro areaEurope & Central AsiaEurope & Central Asia (excluding high income)Europe & Central Asia (IDA & IBRD countries)European UnionFijiFinlandFragile and conflict affected situationsFranceGabonGambia, TheGeorgiaGermanyGhanaGreeceGrenadaGuatemalaGuineaGuinea-BissauGuyanaHaitiHeavily indebted poor countries (HIPC)High incomeHondurasHong Kong SAR, ChinaHungaryIBRD onlyIcelandIDA & IBRD totalIDA blendIDA onlyIDA totalIndiaIndonesiaIran, Islamic Rep.IraqIrelandIsraelItalyJamaicaJapanJordanKazakhstanKenyaKiribatiKorea, Rep.KosovoKuwaitKyrgyz RepublicLao PDRLate-demographic dividendLatin America & Caribbean Latin America & Caribbean (excluding high income)Latin America & the Caribbean (IDA & IBRD countries)LatviaLeast developed countries: UN classificationLebanonLesothoLiberiaLibyaLithuaniaLow & middle incomeLow incomeLower middle incomeLuxembourgMacao SAR, ChinaMacedonia, FYRMadagascarMalawiMalaysiaMaldivesMaliMaltaMauritaniaMauritiusMexicoMicronesia, Fed. Sts.Middle East & North AfricaMiddle East & North Africa (excluding high income)Middle East & North Africa (IDA & IBRD countries)Middle incomeMoldovaMongoliaMontenegroMoroccoMozambiqueNamibiaNepalNetherlandsNew CaledoniaNew ZealandNicaraguaNigerNigeriaNorth AmericaNorwayOECD membersOmanPakistanPanamaPapua New GuineaParaguayPeruPhilippinesPolandPortugalPost-demographic dividendPre-demographic dividendPuerto RicoRomaniaRussian FederationRwandaSaudi ArabiaSenegalSerbiaSeychellesSierra LeoneSingaporeSlovak RepublicSloveniaSolomon IslandsSomaliaSouth AfricaSouth AsiaSouth Asia (IDA & IBRD)South SudanSpainSri LankaSt. Kitts and NevisSt. LuciaSt. Vincent and the GrenadinesSub-Saharan Africa Sub-Saharan Africa (excluding high income)Sub-Saharan Africa (IDA & IBRD countries)SudanSurinameSwazilandSwedenSwitzerlandSyrian Arab RepublicTajikistanTanzaniaThailandTimor-LesteTogoTongaTrinidad and TobagoTunisiaTurkeyTurkmenistanUgandaUkraineUnited Arab EmiratesUnited KingdomUnited StatesUpper middle incomeUruguayUzbekistanVanuatuVenezuela, RBVietnamWest Bank and GazaWorldYemen, Rep.ZambiaZimbabwe Timeline:
This timeline shows a graph from 1977 to 2016 of Seychelles. No data until 1976. Number of actual observations by date: 38.
Source name:
World Development Indicators
Source organization:
World Bank national accounts data, and OECD National Accounts data files.
Categories, topics:
Economy & Growth
Last updated:
apr 23, 2017
Indicators value changes by year
Minimum:
18.129 mln
jan 1, 1977
Maximum:
534.818 mln
jan 1, 2014
At the date of observation
Value
Absolute change
Change from previous value
jan 1, 1977
18.129 mln
+18.129 mln
0.0%
jan 1, 1978
24.924 mln
+6.794 mln
37.48%
jan 1, 1979
36.447 mln
+11.524 mln
46.24%
jan 1, 1980
40.52 mln
+4.073 mln
11.17%
jan 1, 1981
53.849 mln
+13.329 mln
32.89%
jan 1, 1982
52.194 mln
-1.655 mln
-3.07%
jan 1, 1983
46.226 mln
-5.967 mln
-11.43%
jan 1, 1984
32.493 mln
-13.733 mln
-29.71%
jan 1, 1985
32.144 mln
-348.885K
-1.07%
jan 1, 1986
38.336 mln
+6.192 mln
19.26%
jan 1, 1987
46.448 mln
+8.112 mln
21.16%
jan 1, 1988
46.446 mln
-1.702K
0.0%
jan 1, 1989
66.369 mln
+19.922 mln
42.89%
jan 1, 1990
74.038 mln
+7.67 mln
11.56%
jan 1, 1991
84.675 mln
+10.636 mln
14.37%
jan 1, 1992
79.803 mln
-4.872 mln
-5.75%
jan 1, 1993
90.865 mln
+11.062 mln
13.86%
jan 1, 1994
125.678 mln
+34.813 mln
38.31%
jan 1, 1995
128.269 mln
+2.591 mln
2.06%
jan 1, 1996
154.119 mln
+25.851 mln
20.15%
jan 1, 1997
200.447 mln
+46.328 mln
30.06%
jan 1, 1998
157.929 mln
-42.517 mln
-21.21%
jan 1, 1999
206.819 mln
+48.889 mln
30.96%
jan 1, 2000
258.456 mln
+51.637 mln
24.97%
jan 1, 2001
154.818 mln
-103.638 mln
-40.1%
jan 1, 2002
253.009 mln
+98.191 mln
63.42%
jan 1, 2003
192.651 mln
-60.358 mln
-23.86%
jan 1, 2004
76.938 mln
-115.713 mln
-60.06%
jan 1, 2007
309.437 mln
+232.499 mln
302.19%
jan 1, 2008
299.951 mln
-9.486 mln
-3.07%
jan 1, 2009
260.225 mln
-39.726 mln
-13.24%
jan 1, 2010
231.155 mln
-29.07 mln
-11.17%
jan 1, 2011
355.243 mln
+124.088 mln
53.68%
jan 1, 2012
373.395 mln
+18.152 mln
5.11%
jan 1, 2013
423.891 mln
+50.496 mln
13.52%
jan 1, 2014
534.818 mln
+110.928 mln
26.17%
jan 1, 2015
530.87 mln
-3.948 mln
-0.74%
jan 1, 2016
484.916 mln
-45.954 mln
-8.66%
Ranking of countries by current statistics by years


Comments: