29
/
en
AIzaSyAYiBZKx7MnpbEhh9jyipgxe19OcubqV5w
April 1, 2024
113649
Cote d'Ivoire
CIV
true
2
1
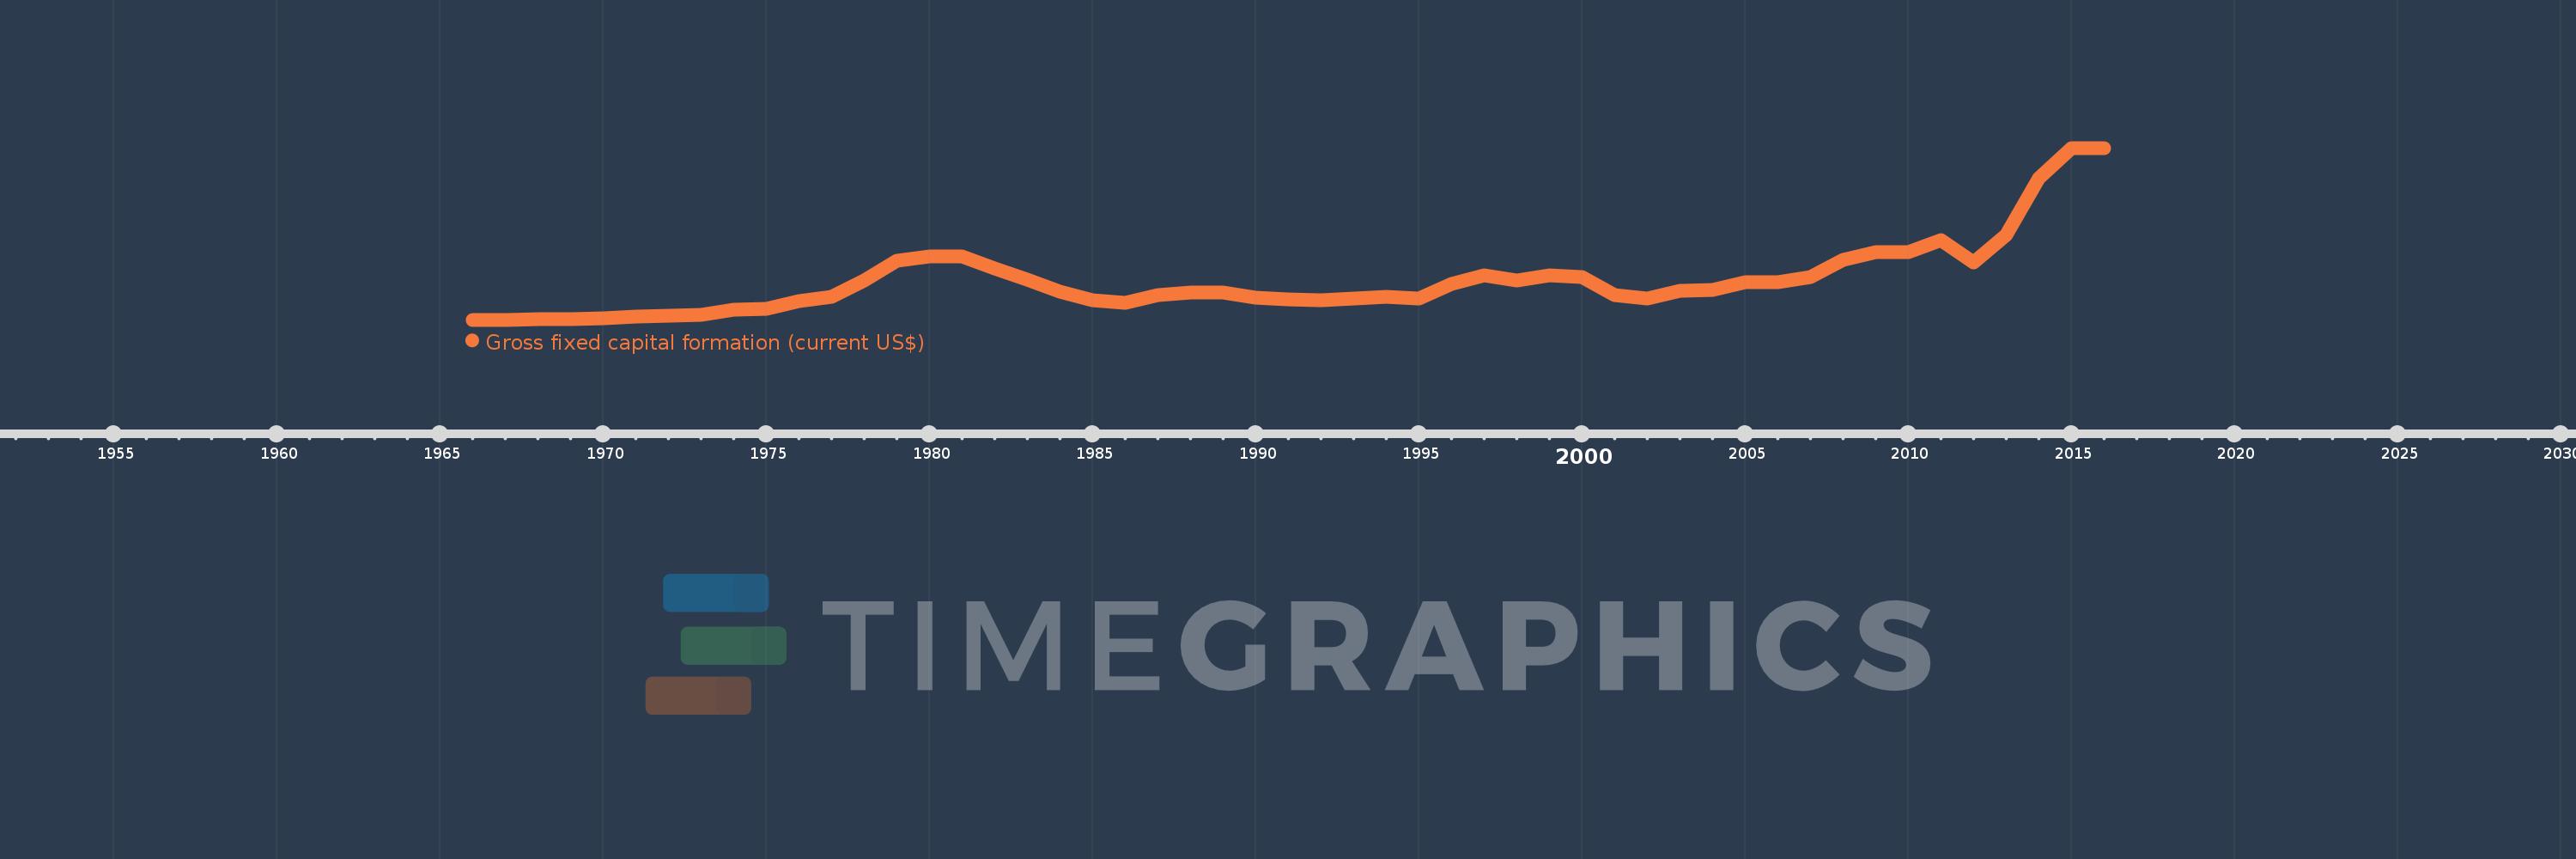
Gross fixed capital formation (current US$)
2016,2015,2014,2013,2012,2011,2010,2009,2008,2007,2006,2005,2004,2003,2002,2001,2000,1999,1998,1997,1996,1995,1994,1993,1992,1991,1990,1989,1988,1987,1986,1985,1984,1983,1982,1981,1980,1979,1978,1977,1976,1975,1974,1973,1972,1971,1970,1969,1968,1967,1966
This statistics in other country:
AfghanistanAlbaniaAlgeriaAngolaAntigua and BarbudaArab WorldArgentinaArmeniaArubaAustraliaAustriaAzerbaijanBahamas, TheBahrainBangladeshBarbadosBelarusBelgiumBelizeBeninBermudaBhutanBoliviaBosnia and HerzegovinaBotswanaBrazilBrunei DarussalamBulgariaBurkina FasoBurundiCabo VerdeCambodiaCameroonCanadaCaribbean small statesCentral African RepublicCentral Europe and the BalticsChadChileChinaColombiaComorosCongo, Dem. Rep.Congo, Rep.Costa RicaCote d'IvoireCroatiaCubaCyprusCzech RepublicDenmarkDjiboutiDominicaDominican RepublicEarly-demographic dividendEast Asia & PacificEast Asia & Pacific (excluding high income)East Asia & Pacific (IDA & IBRD countries)EcuadorEgypt, Arab Rep.El SalvadorEquatorial GuineaEritreaEstoniaEthiopiaEuro areaEurope & Central AsiaEurope & Central Asia (excluding high income)Europe & Central Asia (IDA & IBRD countries)European UnionFijiFinlandFragile and conflict affected situationsFranceGabonGambia, TheGeorgiaGermanyGhanaGreeceGrenadaGuatemalaGuineaGuinea-BissauGuyanaHaitiHeavily indebted poor countries (HIPC)High incomeHondurasHong Kong SAR, ChinaHungaryIBRD onlyIcelandIDA & IBRD totalIDA blendIDA onlyIDA totalIndiaIndonesiaIran, Islamic Rep.IraqIrelandIsraelItalyJamaicaJapanJordanKazakhstanKenyaKiribatiKorea, Rep.KosovoKuwaitKyrgyz RepublicLao PDRLate-demographic dividendLatin America & Caribbean Latin America & Caribbean (excluding high income)Latin America & the Caribbean (IDA & IBRD countries)LatviaLeast developed countries: UN classificationLebanonLesothoLiberiaLibyaLithuaniaLow & middle incomeLow incomeLower middle incomeLuxembourgMacao SAR, ChinaMacedonia, FYRMadagascarMalawiMalaysiaMaldivesMaliMaltaMauritaniaMauritiusMexicoMicronesia, Fed. Sts.Middle East & North AfricaMiddle East & North Africa (excluding high income)Middle East & North Africa (IDA & IBRD countries)Middle incomeMoldovaMongoliaMontenegroMoroccoMozambiqueNamibiaNepalNetherlandsNew CaledoniaNew ZealandNicaraguaNigerNigeriaNorth AmericaNorwayOECD membersOmanPakistanPanamaPapua New GuineaParaguayPeruPhilippinesPolandPortugalPost-demographic dividendPre-demographic dividendPuerto RicoRomaniaRussian FederationRwandaSaudi ArabiaSenegalSerbiaSeychellesSierra LeoneSingaporeSlovak RepublicSloveniaSolomon IslandsSomaliaSouth AfricaSouth AsiaSouth Asia (IDA & IBRD)South SudanSpainSri LankaSt. Kitts and NevisSt. LuciaSt. Vincent and the GrenadinesSub-Saharan Africa Sub-Saharan Africa (excluding high income)Sub-Saharan Africa (IDA & IBRD countries)SudanSurinameSwazilandSwedenSwitzerlandSyrian Arab RepublicTajikistanTanzaniaThailandTimor-LesteTogoTongaTrinidad and TobagoTunisiaTurkeyTurkmenistanUgandaUkraineUnited Arab EmiratesUnited KingdomUnited StatesUpper middle incomeUruguayUzbekistanVanuatuVenezuela, RBVietnamWest Bank and GazaWorldYemen, Rep.ZambiaZimbabwe Timeline:
This timeline shows a graph from 1966 to 2016 of Cote d'Ivoire. No data until 1965. Number of actual observations by date: 51.
Source name:
World Development Indicators
Source organization:
World Bank national accounts data, and OECD National Accounts data files.
Categories, topics:
Economy & Growth
Last updated:
apr 23, 2017
Indicators value changes by year
Minimum:
195.87 mln
jan 1, 1966
Maximum:
6.408 bln
jan 1, 2015
At the date of observation
Value
Absolute change
Change from previous value
jan 1, 1966
195.87 mln
+195.87 mln
0.0%
jan 1, 1967
201.076 mln
+5.206 mln
2.66%
jan 1, 1968
207.723 mln
+6.647 mln
3.31%
jan 1, 1969
222.164 mln
+14.441 mln
6.95%
jan 1, 1970
235.805 mln
+13.641 mln
6.14%
jan 1, 1971
300.648 mln
+64.843 mln
27.5%
jan 1, 1972
332.296 mln
+31.648 mln
10.53%
jan 1, 1973
373.769 mln
+41.472 mln
12.48%
jan 1, 1974
546.909 mln
+173.14 mln
46.32%
jan 1, 1975
596.582 mln
+49.673 mln
9.08%
jan 1, 1976
858.091 mln
+261.51 mln
43.83%
jan 1, 1977
1.035 bln
+176.433 mln
20.56%
jan 1, 1978
1.618 bln
+583.843 mln
56.44%
jan 1, 1979
2.343 bln
+725.024 mln
44.8%
jan 1, 1980
2.478 bln
+134.496 mln
5.74%
jan 1, 1981
2.478 bln
+346.127K
0.01%
jan 1, 1982
2.055 bln
-423.263 mln
-17.08%
jan 1, 1983
1.639 bln
-415.622 mln
-20.23%
jan 1, 1984
1.212 bln
-427.484 mln
-26.08%
jan 1, 1985
887.044 mln
-324.819 mln
-26.8%
jan 1, 1986
821.345 mln
-65.699 mln
-7.41%
jan 1, 1987
1.082 bln
+260.935 mln
31.77%
jan 1, 1988
1.187 bln
+105.006 mln
9.7%
jan 1, 1989
1.178 bln
-9.495 mln
-0.8%
jan 1, 1990
1.007 bln
-171.068 mln
-14.52%
jan 1, 1991
917.878 mln
-88.845 mln
-8.83%
jan 1, 1992
899.659 mln
-18.22 mln
-1.98%
jan 1, 1993
948.273 mln
+48.614 mln
5.4%
jan 1, 1994
1.032 bln
+84.005 mln
8.86%
jan 1, 1995
960.15 mln
-72.127 mln
-6.99%
jan 1, 1996
1.505 bln
+545.343 mln
56.8%
jan 1, 1997
1.798 bln
+292.088 mln
19.4%
jan 1, 1998
1.63 bln
-167.636 mln
-9.33%
jan 1, 1999
1.807 bln
+176.555 mln
10.83%
jan 1, 2000
1.733 bln
-73.995 mln
-4.1%
jan 1, 2001
1.101 bln
-631.602 mln
-36.46%
jan 1, 2002
967.146 mln
-133.758 mln
-12.15%
jan 1, 2003
1.243 bln
+276.257 mln
28.56%
jan 1, 2004
1.263 bln
+19.923 mln
1.6%
jan 1, 2005
1.548 bln
+284.393 mln
22.51%
jan 1, 2006
1.566 bln
+18.447 mln
1.19%
jan 1, 2007
1.742 bln
+176.203 mln
11.25%
jan 1, 2008
2.363 bln
+620.5 mln
35.61%
jan 1, 2009
2.65 bln
+287.016 mln
12.15%
jan 1, 2010
2.639 bln
-10.673 mln
-0.4%
jan 1, 2011
3.065 bln
+425.699 mln
16.13%
jan 1, 2012
2.272 bln
-792.97 mln
-25.87%
jan 1, 2013
3.274 bln
+1.002 bln
44.09%
jan 1, 2014
5.313 bln
+2.04 bln
62.3%
jan 1, 2015
6.408 bln
+1.095 bln
20.6%
jan 1, 2016
6.391 bln
-17.571 mln
-0.27%
Ranking of countries by current statistics by years


Comments: