29
/
en
AIzaSyAYiBZKx7MnpbEhh9jyipgxe19OcubqV5w
April 1, 2024
102489
Central African Republic
CAF
true
2
1
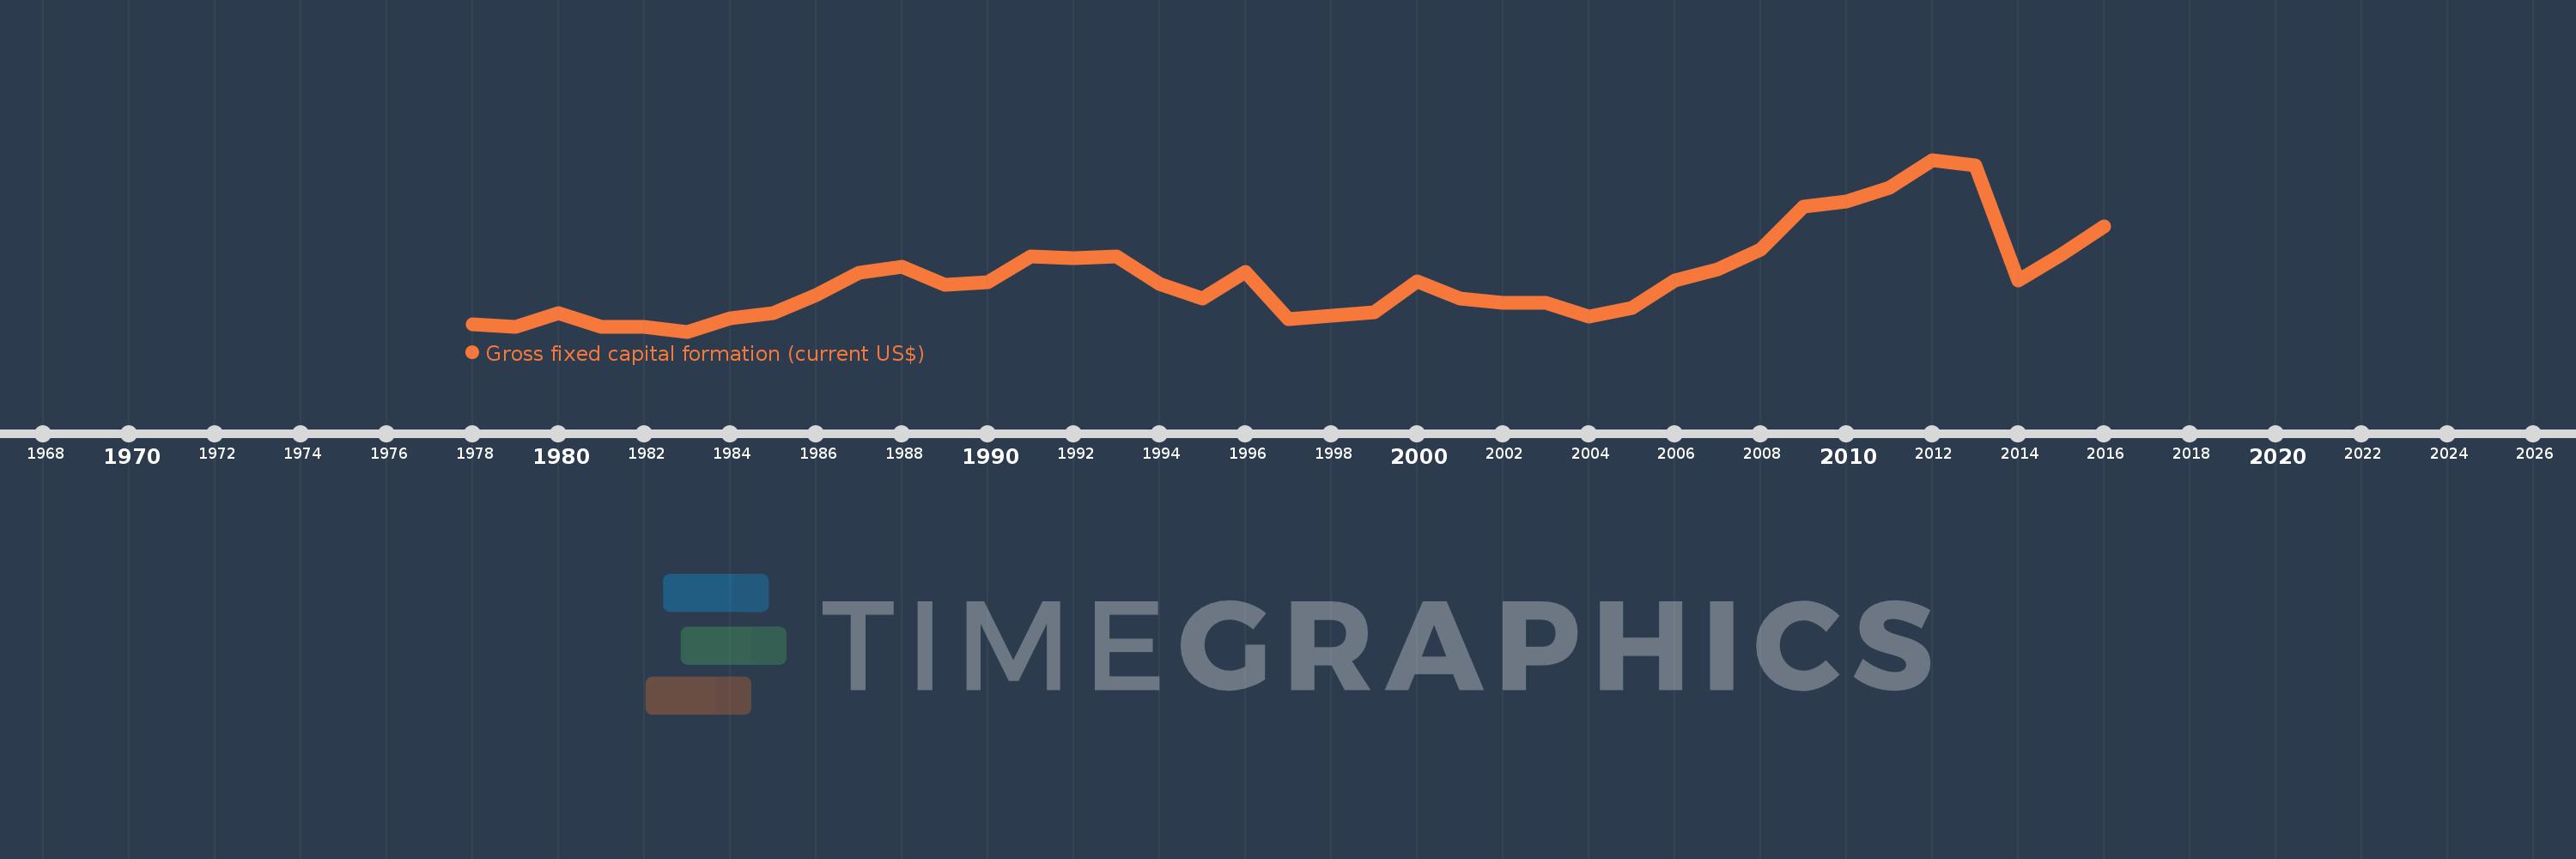
Gross fixed capital formation (current US$)
2016,2015,2014,2013,2012,2011,2010,2009,2008,2007,2006,2005,2004,2003,2002,2001,2000,1999,1998,1997,1996,1995,1994,1993,1992,1991,1990,1989,1988,1987,1986,1985,1984,1983,1982,1981,1980,1979,1978
This statistics in other country:
AfghanistanAlbaniaAlgeriaAngolaAntigua and BarbudaArab WorldArgentinaArmeniaArubaAustraliaAustriaAzerbaijanBahamas, TheBahrainBangladeshBarbadosBelarusBelgiumBelizeBeninBermudaBhutanBoliviaBosnia and HerzegovinaBotswanaBrazilBrunei DarussalamBulgariaBurkina FasoBurundiCabo VerdeCambodiaCameroonCanadaCaribbean small statesCentral African RepublicCentral Europe and the BalticsChadChileChinaColombiaComorosCongo, Dem. Rep.Congo, Rep.Costa RicaCote d'IvoireCroatiaCubaCyprusCzech RepublicDenmarkDjiboutiDominicaDominican RepublicEarly-demographic dividendEast Asia & PacificEast Asia & Pacific (excluding high income)East Asia & Pacific (IDA & IBRD countries)EcuadorEgypt, Arab Rep.El SalvadorEquatorial GuineaEritreaEstoniaEthiopiaEuro areaEurope & Central AsiaEurope & Central Asia (excluding high income)Europe & Central Asia (IDA & IBRD countries)European UnionFijiFinlandFragile and conflict affected situationsFranceGabonGambia, TheGeorgiaGermanyGhanaGreeceGrenadaGuatemalaGuineaGuinea-BissauGuyanaHaitiHeavily indebted poor countries (HIPC)High incomeHondurasHong Kong SAR, ChinaHungaryIBRD onlyIcelandIDA & IBRD totalIDA blendIDA onlyIDA totalIndiaIndonesiaIran, Islamic Rep.IraqIrelandIsraelItalyJamaicaJapanJordanKazakhstanKenyaKiribatiKorea, Rep.KosovoKuwaitKyrgyz RepublicLao PDRLate-demographic dividendLatin America & Caribbean Latin America & Caribbean (excluding high income)Latin America & the Caribbean (IDA & IBRD countries)LatviaLeast developed countries: UN classificationLebanonLesothoLiberiaLibyaLithuaniaLow & middle incomeLow incomeLower middle incomeLuxembourgMacao SAR, ChinaMacedonia, FYRMadagascarMalawiMalaysiaMaldivesMaliMaltaMauritaniaMauritiusMexicoMicronesia, Fed. Sts.Middle East & North AfricaMiddle East & North Africa (excluding high income)Middle East & North Africa (IDA & IBRD countries)Middle incomeMoldovaMongoliaMontenegroMoroccoMozambiqueNamibiaNepalNetherlandsNew CaledoniaNew ZealandNicaraguaNigerNigeriaNorth AmericaNorwayOECD membersOmanPakistanPanamaPapua New GuineaParaguayPeruPhilippinesPolandPortugalPost-demographic dividendPre-demographic dividendPuerto RicoRomaniaRussian FederationRwandaSaudi ArabiaSenegalSerbiaSeychellesSierra LeoneSingaporeSlovak RepublicSloveniaSolomon IslandsSomaliaSouth AfricaSouth AsiaSouth Asia (IDA & IBRD)South SudanSpainSri LankaSt. Kitts and NevisSt. LuciaSt. Vincent and the GrenadinesSub-Saharan Africa Sub-Saharan Africa (excluding high income)Sub-Saharan Africa (IDA & IBRD countries)SudanSurinameSwazilandSwedenSwitzerlandSyrian Arab RepublicTajikistanTanzaniaThailandTimor-LesteTogoTongaTrinidad and TobagoTunisiaTurkeyTurkmenistanUgandaUkraineUnited Arab EmiratesUnited KingdomUnited StatesUpper middle incomeUruguayUzbekistanVanuatuVenezuela, RBVietnamWest Bank and GazaWorldYemen, Rep.ZambiaZimbabwe Timeline:
This timeline shows a graph from 1978 to 2016 of Central African Republic. No data until 1977. Number of actual observations by date: 39.
Source name:
World Development Indicators
Source organization:
World Bank national accounts data, and OECD National Accounts data files.
Categories, topics:
Economy & Growth
Last updated:
apr 23, 2017
Indicators value changes by year
Minimum:
47.778 mln
jan 1, 1983
Maximum:
328.822 mln
jan 1, 2012
At the date of observation
Value
Absolute change
Change from previous value
jan 1, 1978
59.02 mln
+59.02 mln
0.0%
jan 1, 1979
55.394 mln
-3.626 mln
-6.14%
jan 1, 1980
78.506 mln
+23.112 mln
41.72%
jan 1, 1981
55.377 mln
-23.13 mln
-29.46%
jan 1, 1982
55.938 mln
+560.713K
1.01%
jan 1, 1983
47.778 mln
-8.16 mln
-14.59%
jan 1, 1984
69.017 mln
+21.239 mln
44.45%
jan 1, 1985
77.353 mln
+8.336 mln
12.08%
jan 1, 1986
107.24 mln
+29.887 mln
38.64%
jan 1, 1987
144.375 mln
+37.135 mln
34.63%
jan 1, 1988
154.394 mln
+10.019 mln
6.94%
jan 1, 1989
124.574 mln
-29.82 mln
-19.31%
jan 1, 1990
129.097 mln
+4.523 mln
3.63%
jan 1, 1991
170.187 mln
+41.09 mln
31.83%
jan 1, 1992
167.72 mln
-2.467 mln
-1.45%
jan 1, 1993
171.35 mln
+3.63 mln
2.16%
jan 1, 1994
126.083 mln
-45.267 mln
-26.42%
jan 1, 1995
101.588 mln
-24.495 mln
-19.43%
jan 1, 1996
145.602 mln
+44.014 mln
43.33%
jan 1, 1997
67.482 mln
-78.12 mln
-53.65%
jan 1, 1998
73.506 mln
+6.024 mln
8.93%
jan 1, 1999
79.805 mln
+6.299 mln
8.57%
jan 1, 2000
129.552 mln
+49.747 mln
62.34%
jan 1, 2001
101.256 mln
-28.296 mln
-21.84%
jan 1, 2002
95.427 mln
-5.829 mln
-5.76%
jan 1, 2003
95.421 mln
-6.903K
-0.01%
jan 1, 2004
72.999 mln
-22.422 mln
-23.5%
jan 1, 2005
86.52 mln
+13.521 mln
18.52%
jan 1, 2006
131.928 mln
+45.409 mln
52.48%
jan 1, 2007
149.477 mln
+17.549 mln
13.3%
jan 1, 2008
181.423 mln
+31.946 mln
21.37%
jan 1, 2009
252.706 mln
+71.283 mln
39.29%
jan 1, 2010
260.901 mln
+8.195 mln
3.24%
jan 1, 2011
283.32 mln
+22.42 mln
8.59%
jan 1, 2012
328.822 mln
+45.502 mln
16.06%
jan 1, 2013
320.247 mln
-8.575 mln
-2.61%
jan 1, 2014
131.986 mln
-188.262 mln
-58.79%
jan 1, 2015
173.691 mln
+41.705 mln
31.6%
jan 1, 2016
220.504 mln
+46.813 mln
26.95%
Ranking of countries by current statistics by years


Comments: