29
/
en
AIzaSyAYiBZKx7MnpbEhh9jyipgxe19OcubqV5w
April 1, 2024
269391
Turkey
TUR
true
2
1
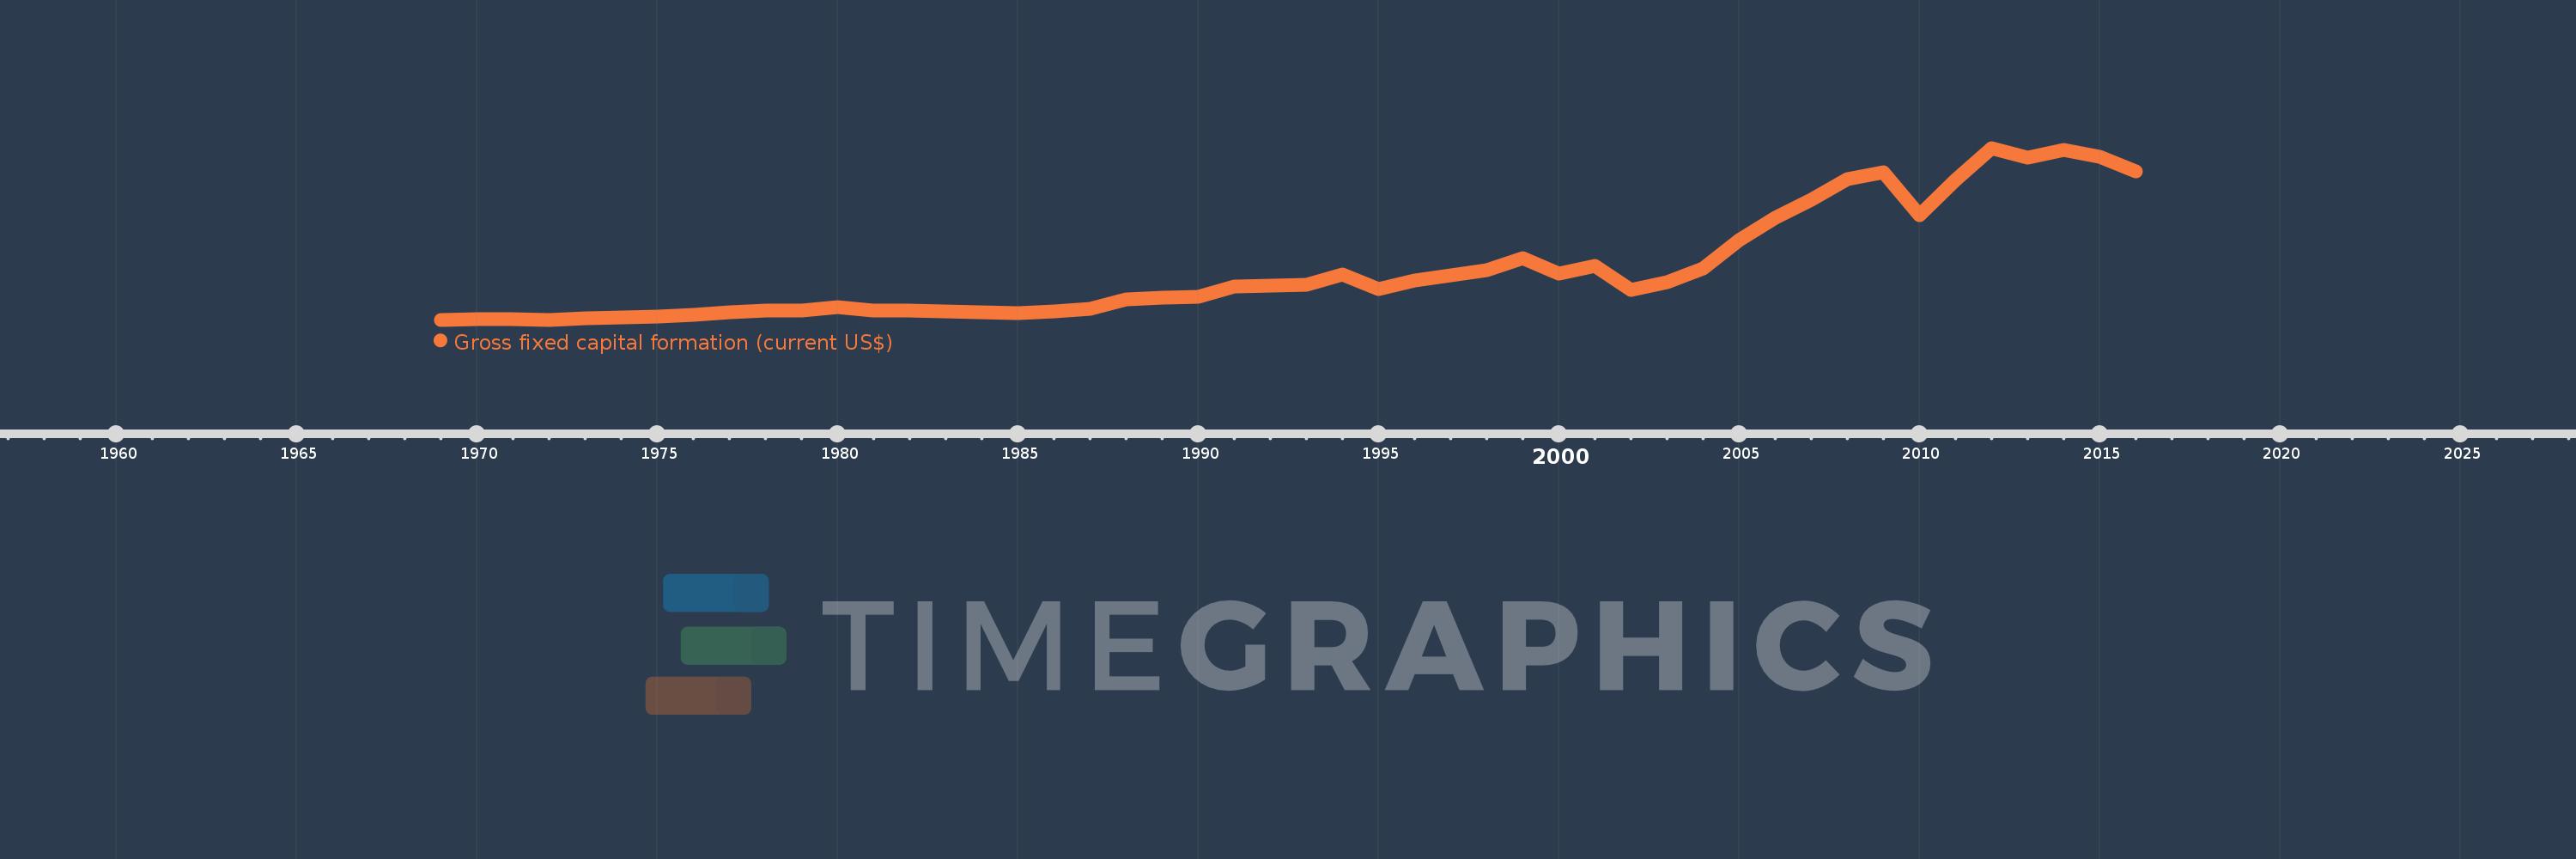
Gross fixed capital formation (current US$)
2016,2015,2014,2013,2012,2011,2010,2009,2008,2007,2006,2005,2004,2003,2002,2001,2000,1999,1998,1997,1996,1995,1994,1993,1992,1991,1990,1989,1988,1987,1986,1985,1984,1983,1982,1981,1980,1979,1978,1977,1976,1975,1974,1973,1972,1971,1970,1969
This statistics in other country:
AfghanistanAlbaniaAlgeriaAngolaAntigua and BarbudaArab WorldArgentinaArmeniaArubaAustraliaAustriaAzerbaijanBahamas, TheBahrainBangladeshBarbadosBelarusBelgiumBelizeBeninBermudaBhutanBoliviaBosnia and HerzegovinaBotswanaBrazilBrunei DarussalamBulgariaBurkina FasoBurundiCabo VerdeCambodiaCameroonCanadaCaribbean small statesCentral African RepublicCentral Europe and the BalticsChadChileChinaColombiaComorosCongo, Dem. Rep.Congo, Rep.Costa RicaCote d'IvoireCroatiaCubaCyprusCzech RepublicDenmarkDjiboutiDominicaDominican RepublicEarly-demographic dividendEast Asia & PacificEast Asia & Pacific (excluding high income)East Asia & Pacific (IDA & IBRD countries)EcuadorEgypt, Arab Rep.El SalvadorEquatorial GuineaEritreaEstoniaEthiopiaEuro areaEurope & Central AsiaEurope & Central Asia (excluding high income)Europe & Central Asia (IDA & IBRD countries)European UnionFijiFinlandFragile and conflict affected situationsFranceGabonGambia, TheGeorgiaGermanyGhanaGreeceGrenadaGuatemalaGuineaGuinea-BissauGuyanaHaitiHeavily indebted poor countries (HIPC)High incomeHondurasHong Kong SAR, ChinaHungaryIBRD onlyIcelandIDA & IBRD totalIDA blendIDA onlyIDA totalIndiaIndonesiaIran, Islamic Rep.IraqIrelandIsraelItalyJamaicaJapanJordanKazakhstanKenyaKiribatiKorea, Rep.KosovoKuwaitKyrgyz RepublicLao PDRLate-demographic dividendLatin America & Caribbean Latin America & Caribbean (excluding high income)Latin America & the Caribbean (IDA & IBRD countries)LatviaLeast developed countries: UN classificationLebanonLesothoLiberiaLibyaLithuaniaLow & middle incomeLow incomeLower middle incomeLuxembourgMacao SAR, ChinaMacedonia, FYRMadagascarMalawiMalaysiaMaldivesMaliMaltaMauritaniaMauritiusMexicoMicronesia, Fed. Sts.Middle East & North AfricaMiddle East & North Africa (excluding high income)Middle East & North Africa (IDA & IBRD countries)Middle incomeMoldovaMongoliaMontenegroMoroccoMozambiqueNamibiaNepalNetherlandsNew CaledoniaNew ZealandNicaraguaNigerNigeriaNorth AmericaNorwayOECD membersOmanPakistanPanamaPapua New GuineaParaguayPeruPhilippinesPolandPortugalPost-demographic dividendPre-demographic dividendPuerto RicoRomaniaRussian FederationRwandaSaudi ArabiaSenegalSerbiaSeychellesSierra LeoneSingaporeSlovak RepublicSloveniaSolomon IslandsSomaliaSouth AfricaSouth AsiaSouth Asia (IDA & IBRD)South SudanSpainSri LankaSt. Kitts and NevisSt. LuciaSt. Vincent and the GrenadinesSub-Saharan Africa Sub-Saharan Africa (excluding high income)Sub-Saharan Africa (IDA & IBRD countries)SudanSurinameSwazilandSwedenSwitzerlandSyrian Arab RepublicTajikistanTanzaniaThailandTimor-LesteTogoTongaTrinidad and TobagoTunisiaTurkeyTurkmenistanUgandaUkraineUnited Arab EmiratesUnited KingdomUnited StatesUpper middle incomeUruguayUzbekistanVanuatuVenezuela, RBVietnamWest Bank and GazaWorldYemen, Rep.ZambiaZimbabwe Timeline:
This timeline shows a graph from 1969 to 2016 of Turkey. No data until 1968. Number of actual observations by date: 48.
Source name:
World Development Indicators
Source organization:
World Bank national accounts data, and OECD National Accounts data files.
Categories, topics:
Economy & Growth
Last updated:
apr 23, 2017
Indicators value changes by year
Minimum:
2.045 bln
jan 1, 1972
Maximum:
169.057 bln
jan 1, 2012
At the date of observation
Value
Absolute change
Change from previous value
jan 1, 1969
2.078 bln
+2.078 bln
0.0%
jan 1, 1970
2.322 bln
+244.444 mln
11.76%
jan 1, 1971
2.261 bln
-61.353 mln
-2.64%
jan 1, 1972
2.045 bln
-216.223 mln
-9.56%
jan 1, 1973
3.194 bln
+1.15 bln
56.23%
jan 1, 1974
4.035 bln
+840.989 mln
26.33%
jan 1, 1975
5.263 bln
+1.228 bln
30.43%
jan 1, 1976
7.194 bln
+1.931 bln
36.69%
jan 1, 1977
9.219 bln
+2.025 bln
28.15%
jan 1, 1978
11.277 bln
+2.057 bln
22.31%
jan 1, 1979
11.091 bln
-186.005 mln
-1.65%
jan 1, 1980
13.923 bln
+2.833 bln
25.54%
jan 1, 1981
10.938 bln
-2.986 bln
-21.44%
jan 1, 1982
10.749 bln
-188.889 mln
-1.73%
jan 1, 1983
9.757 bln
-991.63 mln
-9.23%
jan 1, 1984
9.1 bln
-657.25 mln
-6.74%
jan 1, 1985
8.636 bln
-464.315 mln
-5.1%
jan 1, 1986
10.262 bln
+1.626 bln
18.83%
jan 1, 1987
12.977 bln
+2.715 bln
26.46%
jan 1, 1988
21.572 bln
+8.595 bln
66.23%
jan 1, 1989
23.72 bln
+2.147 bln
9.95%
jan 1, 1990
24.432 bln
+712.27 mln
3.0%
jan 1, 1991
34.459 bln
+10.027 bln
41.04%
jan 1, 1992
35.541 bln
+1.082 bln
3.14%
jan 1, 1993
36.44 bln
+898.961 mln
2.53%
jan 1, 1994
45.988 bln
+9.548 bln
26.2%
jan 1, 1995
31.966 bln
-14.022 bln
-30.49%
jan 1, 1996
40.398 bln
+8.432 bln
26.38%
jan 1, 1997
45.533 bln
+5.135 bln
12.71%
jan 1, 1998
50.154 bln
+4.621 bln
10.15%
jan 1, 1999
61.552 bln
+11.398 bln
22.73%
jan 1, 2000
47.301 bln
-14.251 bln
-23.15%
jan 1, 2001
54.361 bln
+7.06 bln
14.93%
jan 1, 2002
31.245 bln
-23.116 bln
-42.52%
jan 1, 2003
38.881 bln
+7.636 bln
24.44%
jan 1, 2004
51.547 bln
+12.666 bln
32.58%
jan 1, 2005
79.773 bln
+28.226 bln
54.76%
jan 1, 2006
101.574 bln
+21.801 bln
27.33%
jan 1, 2007
118.337 bln
+16.763 bln
16.5%
jan 1, 2008
138.609 bln
+20.272 bln
17.13%
jan 1, 2009
145.287 bln
+6.678 bln
4.82%
jan 1, 2010
103.692 bln
-41.595 bln
-28.63%
jan 1, 2011
138.281 bln
+34.589 bln
33.36%
jan 1, 2012
169.057 bln
+30.776 bln
22.26%
jan 1, 2013
159.867 bln
-9.19 bln
-5.44%
jan 1, 2014
167.342 bln
+7.475 bln
4.68%
jan 1, 2015
160.768 bln
-6.574 bln
-3.93%
jan 1, 2016
146.547 bln
-14.22 bln
-8.85%
Ranking of countries by current statistics by years


Comments: