29
/
en
AIzaSyAYiBZKx7MnpbEhh9jyipgxe19OcubqV5w
April 1, 2024
39956
IDA total
IDA
false
2
1
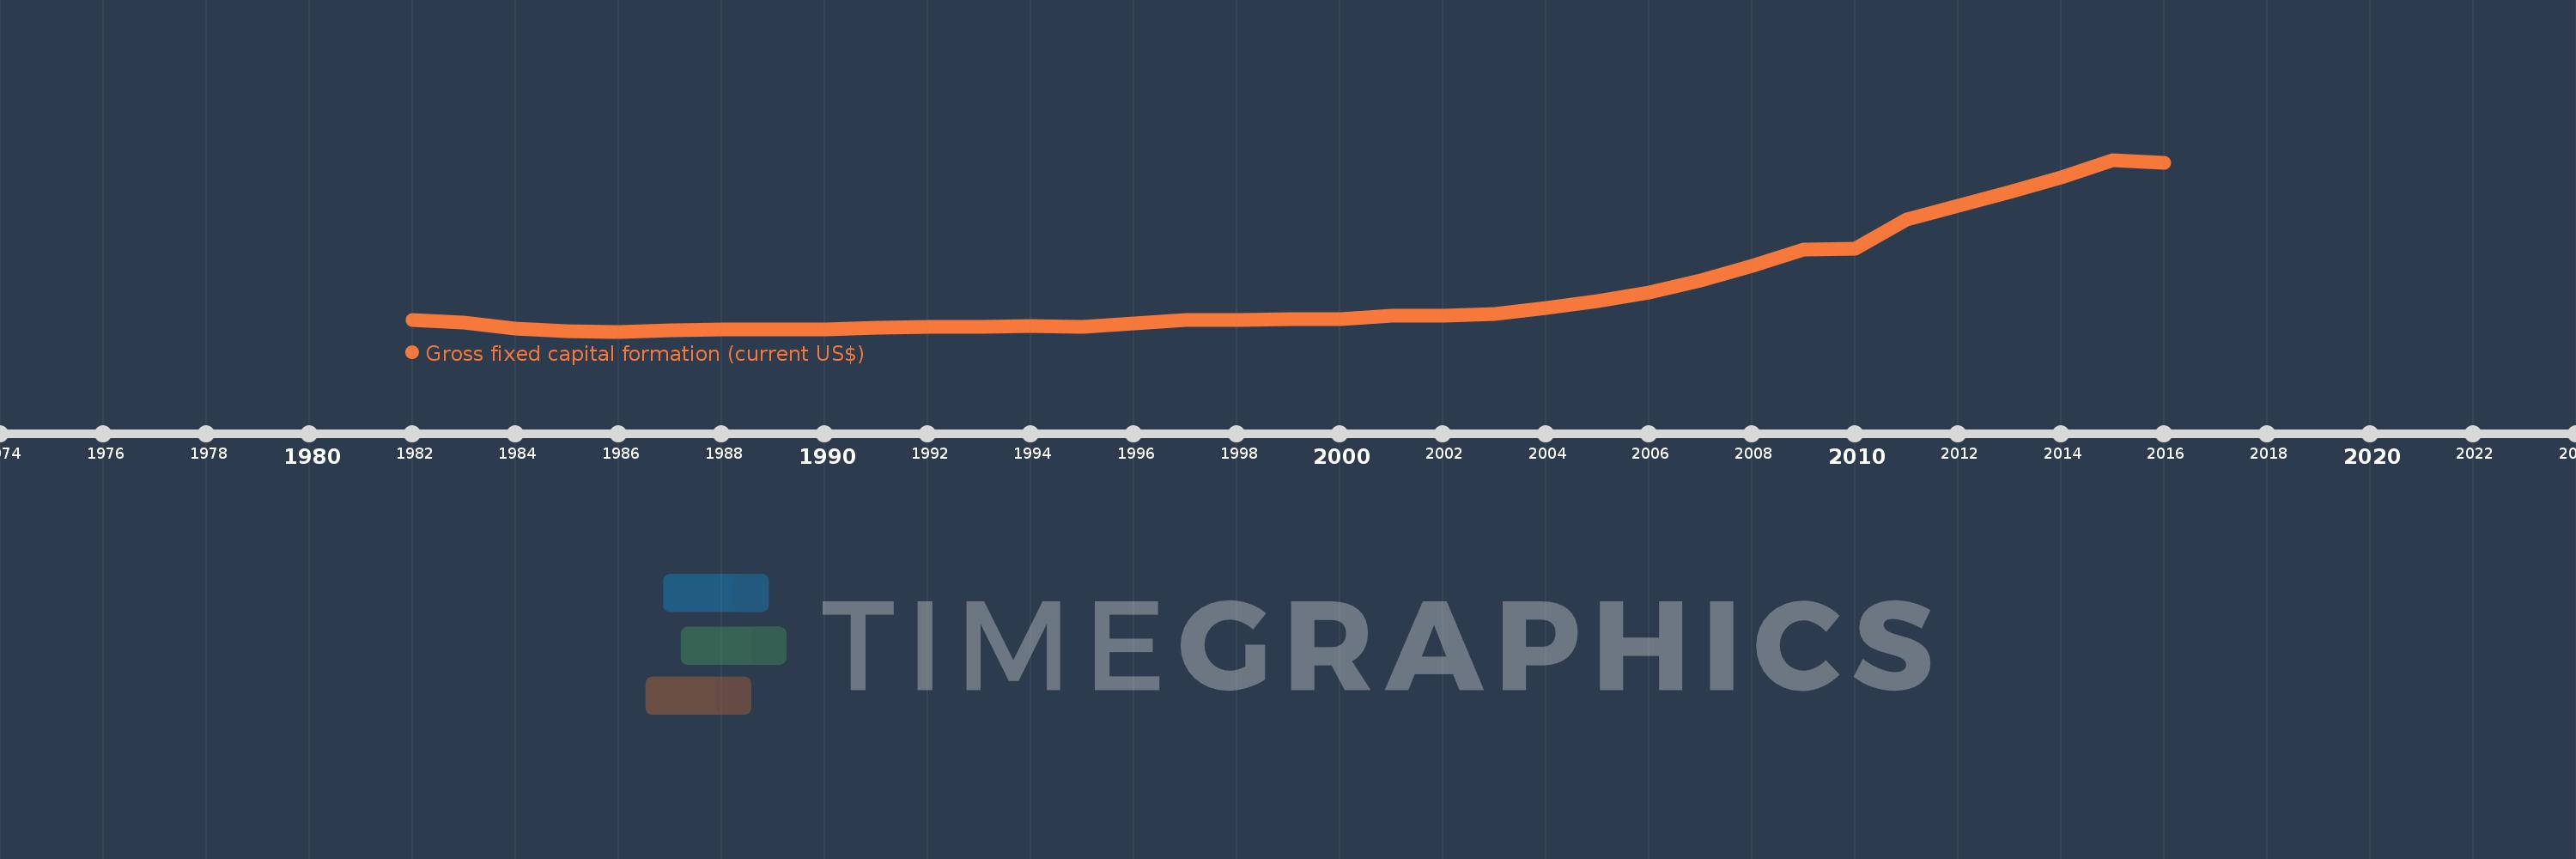
Gross fixed capital formation (current US$)
2016,2015,2014,2013,2012,2011,2010,2009,2008,2007,2006,2005,2004,2003,2002,2001,2000,1999,1998,1997,1996,1995,1994,1993,1992,1991,1990,1989,1988,1987,1986,1985,1984,1983,1982
This statistics in other country:
AfghanistanAlbaniaAlgeriaAngolaAntigua and BarbudaArab WorldArgentinaArmeniaArubaAustraliaAustriaAzerbaijanBahamas, TheBahrainBangladeshBarbadosBelarusBelgiumBelizeBeninBermudaBhutanBoliviaBosnia and HerzegovinaBotswanaBrazilBrunei DarussalamBulgariaBurkina FasoBurundiCabo VerdeCambodiaCameroonCanadaCaribbean small statesCentral African RepublicCentral Europe and the BalticsChadChileChinaColombiaComorosCongo, Dem. Rep.Congo, Rep.Costa RicaCote d'IvoireCroatiaCubaCyprusCzech RepublicDenmarkDjiboutiDominicaDominican RepublicEarly-demographic dividendEast Asia & PacificEast Asia & Pacific (excluding high income)East Asia & Pacific (IDA & IBRD countries)EcuadorEgypt, Arab Rep.El SalvadorEquatorial GuineaEritreaEstoniaEthiopiaEuro areaEurope & Central AsiaEurope & Central Asia (excluding high income)Europe & Central Asia (IDA & IBRD countries)European UnionFijiFinlandFragile and conflict affected situationsFranceGabonGambia, TheGeorgiaGermanyGhanaGreeceGrenadaGuatemalaGuineaGuinea-BissauGuyanaHaitiHeavily indebted poor countries (HIPC)High incomeHondurasHong Kong SAR, ChinaHungaryIBRD onlyIcelandIDA & IBRD totalIDA blendIDA onlyIDA totalIndiaIndonesiaIran, Islamic Rep.IraqIrelandIsraelItalyJamaicaJapanJordanKazakhstanKenyaKiribatiKorea, Rep.KosovoKuwaitKyrgyz RepublicLao PDRLate-demographic dividendLatin America & Caribbean Latin America & Caribbean (excluding high income)Latin America & the Caribbean (IDA & IBRD countries)LatviaLeast developed countries: UN classificationLebanonLesothoLiberiaLibyaLithuaniaLow & middle incomeLow incomeLower middle incomeLuxembourgMacao SAR, ChinaMacedonia, FYRMadagascarMalawiMalaysiaMaldivesMaliMaltaMauritaniaMauritiusMexicoMicronesia, Fed. Sts.Middle East & North AfricaMiddle East & North Africa (excluding high income)Middle East & North Africa (IDA & IBRD countries)Middle incomeMoldovaMongoliaMontenegroMoroccoMozambiqueNamibiaNepalNetherlandsNew CaledoniaNew ZealandNicaraguaNigerNigeriaNorth AmericaNorwayOECD membersOmanPakistanPanamaPapua New GuineaParaguayPeruPhilippinesPolandPortugalPost-demographic dividendPre-demographic dividendPuerto RicoRomaniaRussian FederationRwandaSaudi ArabiaSenegalSerbiaSeychellesSierra LeoneSingaporeSlovak RepublicSloveniaSolomon IslandsSomaliaSouth AfricaSouth AsiaSouth Asia (IDA & IBRD)South SudanSpainSri LankaSt. Kitts and NevisSt. LuciaSt. Vincent and the GrenadinesSub-Saharan Africa Sub-Saharan Africa (excluding high income)Sub-Saharan Africa (IDA & IBRD countries)SudanSurinameSwazilandSwedenSwitzerlandSyrian Arab RepublicTajikistanTanzaniaThailandTimor-LesteTogoTongaTrinidad and TobagoTunisiaTurkeyTurkmenistanUgandaUkraineUnited Arab EmiratesUnited KingdomUnited StatesUpper middle incomeUruguayUzbekistanVanuatuVenezuela, RBVietnamWest Bank and GazaWorldYemen, Rep.ZambiaZimbabwe Timeline:
This timeline shows a graph from 1982 to 2016 of IDA total. No data until 1981. Number of actual observations by date: 35.
Source name:
World Development Indicators
Source organization:
World Bank national accounts data, and OECD National Accounts data files.
Categories, topics:
Economy & Growth
Last updated:
apr 23, 2017
Indicators value changes by year
Minimum:
47.462 bln
jan 1, 1986
Maximum:
501.483 bln
jan 1, 2015
At the date of observation
Value
Absolute change
Change from previous value
jan 1, 1982
78.823 bln
+78.823 bln
0.0%
jan 1, 1983
71.57 bln
-7.253 bln
-9.2%
jan 1, 1984
55.951 bln
-15.619 bln
-21.82%
jan 1, 1985
49.062 bln
-6.889 bln
-12.31%
jan 1, 1986
47.462 bln
-1.6 bln
-3.26%
jan 1, 1987
50.917 bln
+3.455 bln
7.28%
jan 1, 1988
54.069 bln
+3.152 bln
6.19%
jan 1, 1989
53.768 bln
-300.806 mln
-0.56%
jan 1, 1990
53.671 bln
-96.565 mln
-0.18%
jan 1, 1991
58.652 bln
+4.981 bln
9.28%
jan 1, 1992
59.667 bln
+1.015 bln
1.73%
jan 1, 1993
60.71 bln
+1.043 bln
1.75%
jan 1, 1994
61.688 bln
+977.931 mln
1.61%
jan 1, 1995
60.529 bln
-1.16 bln
-1.88%
jan 1, 1996
68.747 bln
+8.218 bln
13.58%
jan 1, 1997
78.437 bln
+9.69 bln
14.1%
jan 1, 1998
78.731 bln
+293.624 mln
0.37%
jan 1, 1999
81.029 bln
+2.299 bln
2.92%
jan 1, 2000
79.45 bln
-1.58 bln
-1.95%
jan 1, 2001
90.321 bln
+10.871 bln
13.68%
jan 1, 2002
89.891 bln
-430.052 mln
-0.48%
jan 1, 2003
93.835 bln
+3.944 bln
4.39%
jan 1, 2004
110.396 bln
+16.561 bln
17.65%
jan 1, 2005
127.293 bln
+16.896 bln
15.31%
jan 1, 2006
149.739 bln
+22.446 bln
17.63%
jan 1, 2007
183.187 bln
+33.449 bln
22.34%
jan 1, 2008
221.567 bln
+38.38 bln
20.95%
jan 1, 2009
263.829 bln
+42.261 bln
19.07%
jan 1, 2010
267.401 bln
+3.572 bln
1.35%
jan 1, 2011
343.352 bln
+75.951 bln
28.4%
jan 1, 2012
381.083 bln
+37.731 bln
10.99%
jan 1, 2013
417.032 bln
+35.95 bln
9.43%
jan 1, 2014
455.199 bln
+38.167 bln
9.15%
jan 1, 2015
501.483 bln
+46.284 bln
10.17%
jan 1, 2016
493.774 bln
-7.709 bln
-1.54%
Ranking of countries by current statistics by years


Comments: