29
/
en
AIzaSyAYiBZKx7MnpbEhh9jyipgxe19OcubqV5w
April 1, 2024
81810
Belgium
BEL
true
2
1
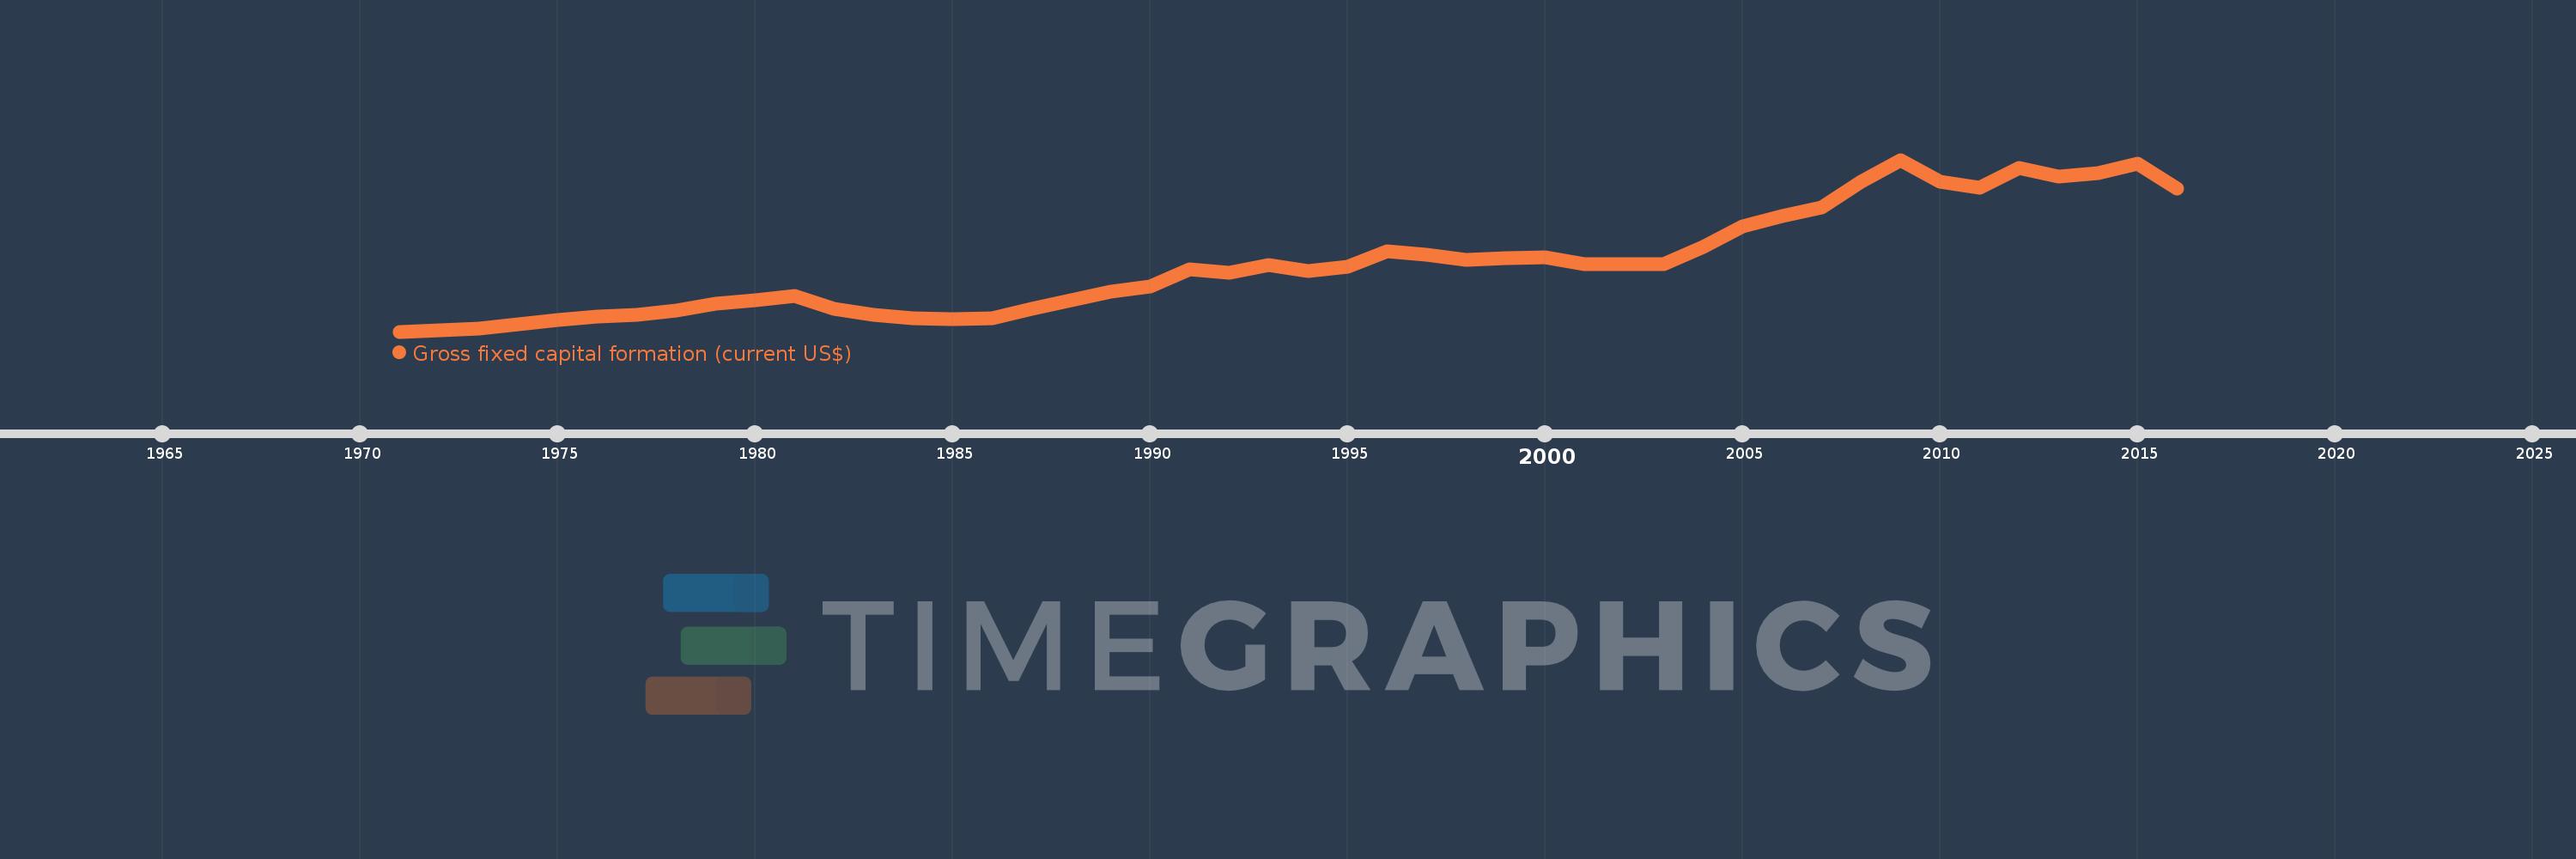
Gross fixed capital formation (current US$)
2016,2015,2014,2013,2012,2011,2010,2009,2008,2007,2006,2005,2004,2003,2002,2001,2000,1999,1998,1997,1996,1995,1994,1993,1992,1991,1990,1989,1988,1987,1986,1985,1984,1983,1982,1981,1980,1979,1978,1977,1976,1975,1974,1973,1972,1971
This statistics in other country:
AfghanistanAlbaniaAlgeriaAngolaAntigua and BarbudaArab WorldArgentinaArmeniaArubaAustraliaAustriaAzerbaijanBahamas, TheBahrainBangladeshBarbadosBelarusBelgiumBelizeBeninBermudaBhutanBoliviaBosnia and HerzegovinaBotswanaBrazilBrunei DarussalamBulgariaBurkina FasoBurundiCabo VerdeCambodiaCameroonCanadaCaribbean small statesCentral African RepublicCentral Europe and the BalticsChadChileChinaColombiaComorosCongo, Dem. Rep.Congo, Rep.Costa RicaCote d'IvoireCroatiaCubaCyprusCzech RepublicDenmarkDjiboutiDominicaDominican RepublicEarly-demographic dividendEast Asia & PacificEast Asia & Pacific (excluding high income)East Asia & Pacific (IDA & IBRD countries)EcuadorEgypt, Arab Rep.El SalvadorEquatorial GuineaEritreaEstoniaEthiopiaEuro areaEurope & Central AsiaEurope & Central Asia (excluding high income)Europe & Central Asia (IDA & IBRD countries)European UnionFijiFinlandFragile and conflict affected situationsFranceGabonGambia, TheGeorgiaGermanyGhanaGreeceGrenadaGuatemalaGuineaGuinea-BissauGuyanaHaitiHeavily indebted poor countries (HIPC)High incomeHondurasHong Kong SAR, ChinaHungaryIBRD onlyIcelandIDA & IBRD totalIDA blendIDA onlyIDA totalIndiaIndonesiaIran, Islamic Rep.IraqIrelandIsraelItalyJamaicaJapanJordanKazakhstanKenyaKiribatiKorea, Rep.KosovoKuwaitKyrgyz RepublicLao PDRLate-demographic dividendLatin America & Caribbean Latin America & Caribbean (excluding high income)Latin America & the Caribbean (IDA & IBRD countries)LatviaLeast developed countries: UN classificationLebanonLesothoLiberiaLibyaLithuaniaLow & middle incomeLow incomeLower middle incomeLuxembourgMacao SAR, ChinaMacedonia, FYRMadagascarMalawiMalaysiaMaldivesMaliMaltaMauritaniaMauritiusMexicoMicronesia, Fed. Sts.Middle East & North AfricaMiddle East & North Africa (excluding high income)Middle East & North Africa (IDA & IBRD countries)Middle incomeMoldovaMongoliaMontenegroMoroccoMozambiqueNamibiaNepalNetherlandsNew CaledoniaNew ZealandNicaraguaNigerNigeriaNorth AmericaNorwayOECD membersOmanPakistanPanamaPapua New GuineaParaguayPeruPhilippinesPolandPortugalPost-demographic dividendPre-demographic dividendPuerto RicoRomaniaRussian FederationRwandaSaudi ArabiaSenegalSerbiaSeychellesSierra LeoneSingaporeSlovak RepublicSloveniaSolomon IslandsSomaliaSouth AfricaSouth AsiaSouth Asia (IDA & IBRD)South SudanSpainSri LankaSt. Kitts and NevisSt. LuciaSt. Vincent and the GrenadinesSub-Saharan Africa Sub-Saharan Africa (excluding high income)Sub-Saharan Africa (IDA & IBRD countries)SudanSurinameSwazilandSwedenSwitzerlandSyrian Arab RepublicTajikistanTanzaniaThailandTimor-LesteTogoTongaTrinidad and TobagoTunisiaTurkeyTurkmenistanUgandaUkraineUnited Arab EmiratesUnited KingdomUnited StatesUpper middle incomeUruguayUzbekistanVanuatuVenezuela, RBVietnamWest Bank and GazaWorldYemen, Rep.ZambiaZimbabwe Timeline:
This timeline shows a graph from 1971 to 2016 of Belgium. No data until 1970. Number of actual observations by date: 46.
Source name:
World Development Indicators
Source organization:
World Bank national accounts data, and OECD National Accounts data files.
Categories, topics:
Economy & Growth
Last updated:
apr 23, 2017
Indicators value changes by year
Minimum:
7.263 bln
jan 1, 1971
Maximum:
124.344 bln
jan 1, 2009
At the date of observation
Value
Absolute change
Change from previous value
jan 1, 1971
7.263 bln
+7.263 bln
0.0%
jan 1, 1972
7.884 bln
+621.619 mln
8.56%
jan 1, 1973
9.507 bln
+1.622 bln
20.58%
jan 1, 1974
12.228 bln
+2.721 bln
28.62%
jan 1, 1975
15.226 bln
+2.998 bln
24.52%
jan 1, 1976
17.636 bln
+2.411 bln
15.83%
jan 1, 1977
18.694 bln
+1.058 bln
6.0%
jan 1, 1978
21.347 bln
+2.653 bln
14.19%
jan 1, 1979
26.091 bln
+4.743 bln
22.22%
jan 1, 1980
28.613 bln
+2.522 bln
9.67%
jan 1, 1981
31.798 bln
+3.185 bln
11.13%
jan 1, 1982
22.807 bln
-8.991 bln
-28.28%
jan 1, 1983
18.881 bln
-3.926 bln
-17.21%
jan 1, 1984
16.487 bln
-2.394 bln
-12.68%
jan 1, 1985
15.464 bln
-1.023 bln
-6.2%
jan 1, 1986
16.402 bln
+937.964 mln
6.07%
jan 1, 1987
22.629 bln
+6.227 bln
37.97%
jan 1, 1988
28.836 bln
+6.207 bln
27.43%
jan 1, 1989
34.552 bln
+5.716 bln
19.82%
jan 1, 1990
37.882 bln
+3.33 bln
9.64%
jan 1, 1991
49.738 bln
+11.856 bln
31.3%
jan 1, 1992
47.614 bln
-2.124 bln
-4.27%
jan 1, 1993
52.408 bln
+4.794 bln
10.07%
jan 1, 1994
48.392 bln
-4.016 bln
-7.66%
jan 1, 1995
51.448 bln
+3.056 bln
6.32%
jan 1, 1996
61.772 bln
+10.324 bln
20.07%
jan 1, 1997
59.926 bln
-1.846 bln
-2.99%
jan 1, 1998
55.934 bln
-3.992 bln
-6.66%
jan 1, 1999
57.166 bln
+1.233 bln
2.2%
jan 1, 2000
57.925 bln
+758.949 mln
1.33%
jan 1, 2001
53.506 bln
-4.419 bln
-7.63%
jan 1, 2002
53.314 bln
-191.534 mln
-0.36%
jan 1, 2003
53.486 bln
+171.615 mln
0.32%
jan 1, 2004
65.204 bln
+11.718 bln
21.91%
jan 1, 2005
79.193 bln
+13.989 bln
21.45%
jan 1, 2006
85.832 bln
+6.639 bln
8.38%
jan 1, 2007
91.575 bln
+5.742 bln
6.69%
jan 1, 2008
109.63 bln
+18.055 bln
19.72%
jan 1, 2009
124.344 bln
+14.714 bln
13.42%
jan 1, 2010
109.449 bln
-14.895 bln
-11.98%
jan 1, 2011
105.516 bln
-3.933 bln
-3.59%
jan 1, 2012
119.005 bln
+13.489 bln
12.78%
jan 1, 2013
112.649 bln
-6.356 bln
-5.34%
jan 1, 2014
115.469 bln
+2.82 bln
2.5%
jan 1, 2015
121.741 bln
+6.271 bln
5.43%
jan 1, 2016
104.643 bln
-17.098 bln
-14.04%
Ranking of countries by current statistics by years


Comments: