29
/
en
AIzaSyAYiBZKx7MnpbEhh9jyipgxe19OcubqV5w
April 1, 2024
182141
Luxembourg
LUX
true
2
1
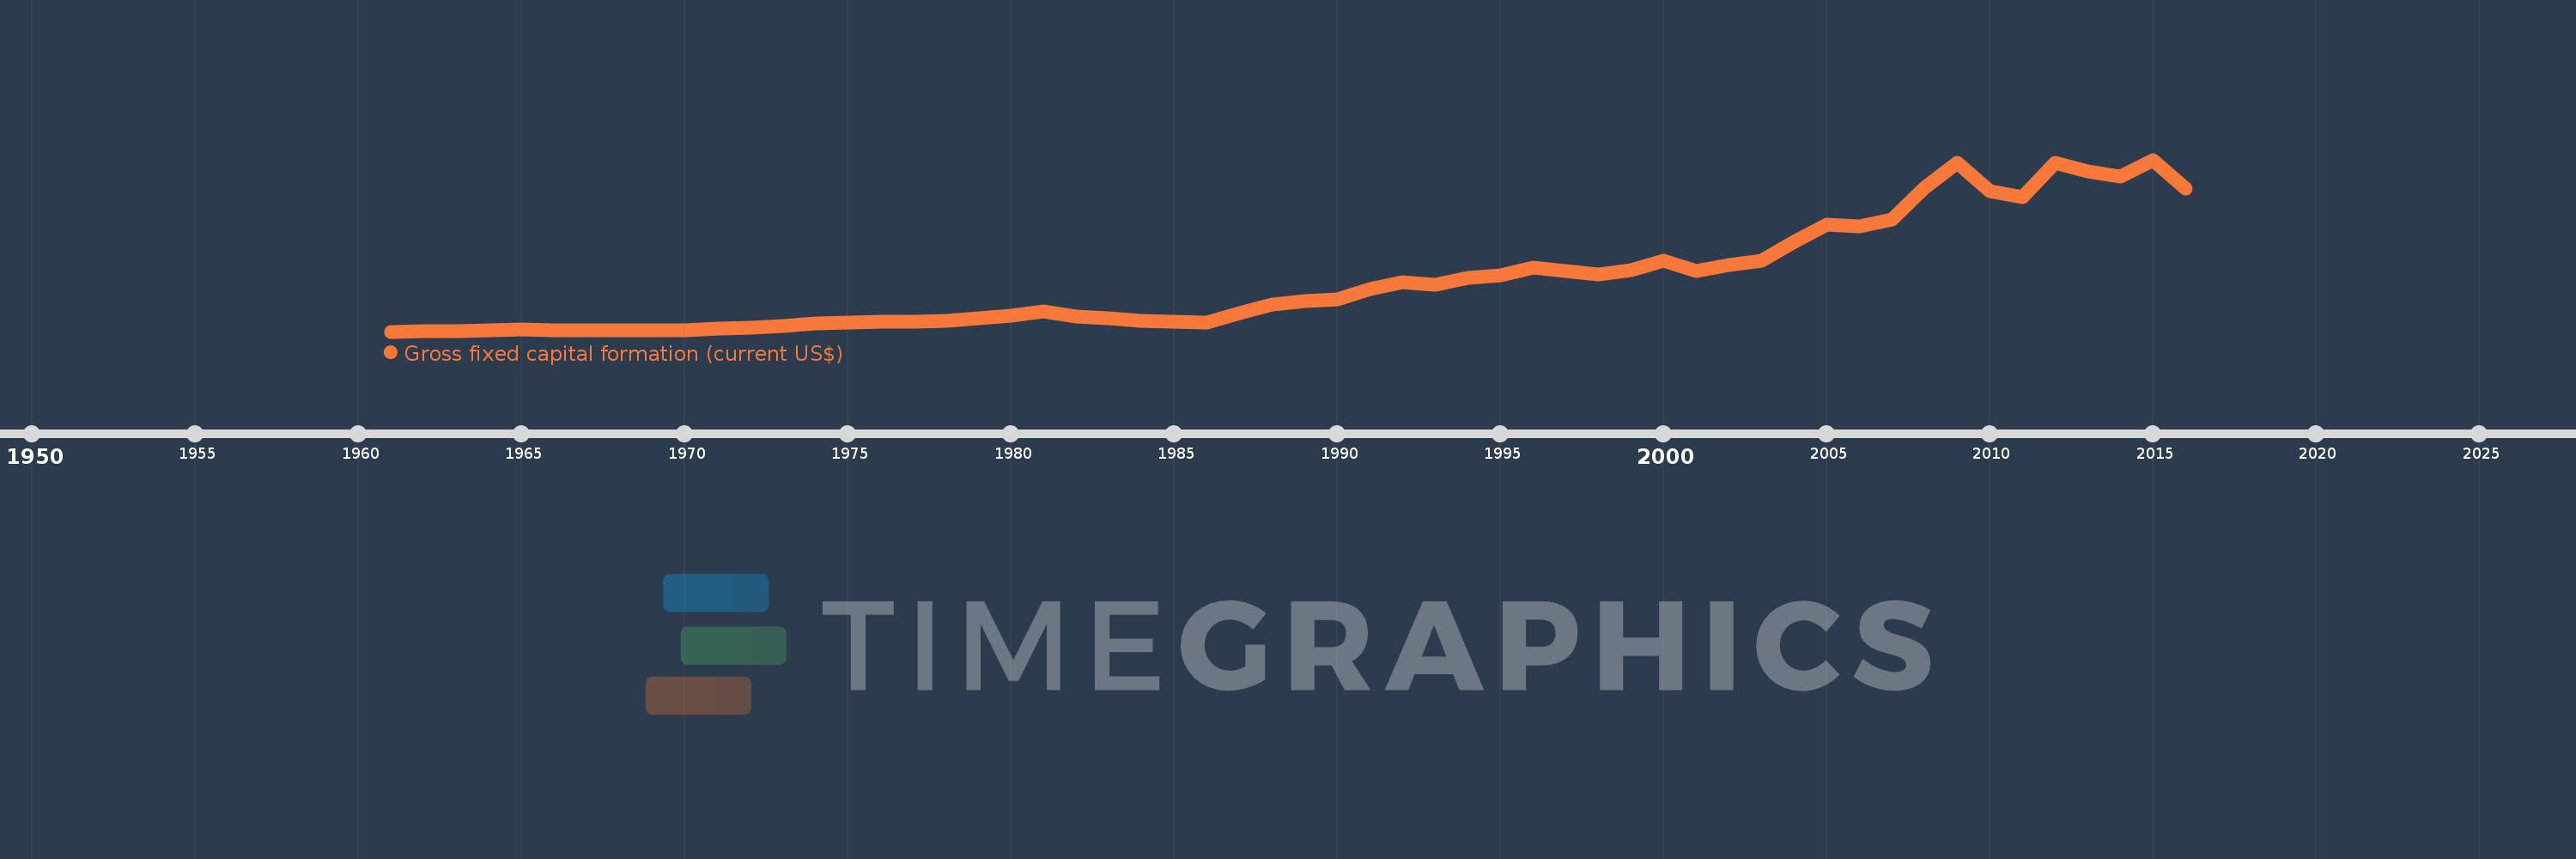
Gross fixed capital formation (current US$)
2016,2015,2014,2013,2012,2011,2010,2009,2008,2007,2006,2005,2004,2003,2002,2001,2000,1999,1998,1997,1996,1995,1994,1993,1992,1991,1990,1989,1988,1987,1986,1985,1984,1983,1982,1981,1980,1979,1978,1977,1976,1975,1974,1973,1972,1971,1970,1969,1968,1967,1966,1965,1964,1963,1962,1961
This statistics in other country:
AfghanistanAlbaniaAlgeriaAngolaAntigua and BarbudaArab WorldArgentinaArmeniaArubaAustraliaAustriaAzerbaijanBahamas, TheBahrainBangladeshBarbadosBelarusBelgiumBelizeBeninBermudaBhutanBoliviaBosnia and HerzegovinaBotswanaBrazilBrunei DarussalamBulgariaBurkina FasoBurundiCabo VerdeCambodiaCameroonCanadaCaribbean small statesCentral African RepublicCentral Europe and the BalticsChadChileChinaColombiaComorosCongo, Dem. Rep.Congo, Rep.Costa RicaCote d'IvoireCroatiaCubaCyprusCzech RepublicDenmarkDjiboutiDominicaDominican RepublicEarly-demographic dividendEast Asia & PacificEast Asia & Pacific (excluding high income)East Asia & Pacific (IDA & IBRD countries)EcuadorEgypt, Arab Rep.El SalvadorEquatorial GuineaEritreaEstoniaEthiopiaEuro areaEurope & Central AsiaEurope & Central Asia (excluding high income)Europe & Central Asia (IDA & IBRD countries)European UnionFijiFinlandFragile and conflict affected situationsFranceGabonGambia, TheGeorgiaGermanyGhanaGreeceGrenadaGuatemalaGuineaGuinea-BissauGuyanaHaitiHeavily indebted poor countries (HIPC)High incomeHondurasHong Kong SAR, ChinaHungaryIBRD onlyIcelandIDA & IBRD totalIDA blendIDA onlyIDA totalIndiaIndonesiaIran, Islamic Rep.IraqIrelandIsraelItalyJamaicaJapanJordanKazakhstanKenyaKiribatiKorea, Rep.KosovoKuwaitKyrgyz RepublicLao PDRLate-demographic dividendLatin America & Caribbean Latin America & Caribbean (excluding high income)Latin America & the Caribbean (IDA & IBRD countries)LatviaLeast developed countries: UN classificationLebanonLesothoLiberiaLibyaLithuaniaLow & middle incomeLow incomeLower middle incomeLuxembourgMacao SAR, ChinaMacedonia, FYRMadagascarMalawiMalaysiaMaldivesMaliMaltaMauritaniaMauritiusMexicoMicronesia, Fed. Sts.Middle East & North AfricaMiddle East & North Africa (excluding high income)Middle East & North Africa (IDA & IBRD countries)Middle incomeMoldovaMongoliaMontenegroMoroccoMozambiqueNamibiaNepalNetherlandsNew CaledoniaNew ZealandNicaraguaNigerNigeriaNorth AmericaNorwayOECD membersOmanPakistanPanamaPapua New GuineaParaguayPeruPhilippinesPolandPortugalPost-demographic dividendPre-demographic dividendPuerto RicoRomaniaRussian FederationRwandaSaudi ArabiaSenegalSerbiaSeychellesSierra LeoneSingaporeSlovak RepublicSloveniaSolomon IslandsSomaliaSouth AfricaSouth AsiaSouth Asia (IDA & IBRD)South SudanSpainSri LankaSt. Kitts and NevisSt. LuciaSt. Vincent and the GrenadinesSub-Saharan Africa Sub-Saharan Africa (excluding high income)Sub-Saharan Africa (IDA & IBRD countries)SudanSurinameSwazilandSwedenSwitzerlandSyrian Arab RepublicTajikistanTanzaniaThailandTimor-LesteTogoTongaTrinidad and TobagoTunisiaTurkeyTurkmenistanUgandaUkraineUnited Arab EmiratesUnited KingdomUnited StatesUpper middle incomeUruguayUzbekistanVanuatuVenezuela, RBVietnamWest Bank and GazaWorldYemen, Rep.ZambiaZimbabwe Timeline:
This timeline shows a graph from 1961 to 2016 of Luxembourg. No data until 1960. Number of actual observations by date: 56.
Source name:
World Development Indicators
Source organization:
World Bank national accounts data, and OECD National Accounts data files.
Categories, topics:
Economy & Growth
Last updated:
apr 23, 2017
Indicators value changes by year
Minimum:
122.485 mln
jan 1, 1961
Maximum:
12.064 bln
jan 1, 2015
At the date of observation
Value
Absolute change
Change from previous value
jan 1, 1961
122.485 mln
+122.485 mln
0.0%
jan 1, 1962
142.003 mln
+19.518 mln
15.93%
jan 1, 1963
160.041 mln
+18.039 mln
12.7%
jan 1, 1964
198.091 mln
+38.05 mln
23.77%
jan 1, 1965
253.597 mln
+55.506 mln
28.02%
jan 1, 1966
216.929 mln
-36.668 mln
-14.46%
jan 1, 1967
216.488 mln
-440.667K
-0.2%
jan 1, 1968
196.14 mln
-20.348 mln
-9.4%
jan 1, 1969
197.838 mln
+1.698 mln
0.87%
jan 1, 1970
230.863 mln
+33.025 mln
16.69%
jan 1, 1971
312.017 mln
+81.154 mln
35.15%
jan 1, 1972
399.531 mln
+87.515 mln
28.05%
jan 1, 1973
490.112 mln
+90.581 mln
22.67%
jan 1, 1974
660.4 mln
+170.287 mln
34.74%
jan 1, 1975
725.173 mln
+64.773 mln
9.81%
jan 1, 1976
803.548 mln
+78.376 mln
10.81%
jan 1, 1977
790.839 mln
-12.709 mln
-1.58%
jan 1, 1978
880.906 mln
+90.067 mln
11.39%
jan 1, 1979
1.053 bln
+171.717 mln
19.49%
jan 1, 1980
1.247 bln
+194.869 mln
18.51%
jan 1, 1981
1.514 bln
+266.141 mln
21.33%
jan 1, 1982
1.192 bln
-322.003 mln
-21.27%
jan 1, 1983
1.067 bln
-125.076 mln
-10.5%
jan 1, 1984
891.132 mln
-175.422 mln
-16.45%
jan 1, 1985
825.214 mln
-65.918 mln
-7.4%
jan 1, 1986
750.211 mln
-75.002 mln
-9.09%
jan 1, 1987
1.391 bln
+640.881 mln
85.43%
jan 1, 1988
1.997 bln
+605.549 mln
43.53%
jan 1, 1989
2.268 bln
+271.235 mln
13.58%
jan 1, 1990
2.362 bln
+94.566 mln
4.17%
jan 1, 1991
3.048 bln
+685.735 mln
29.03%
jan 1, 1992
3.554 bln
+505.399 mln
16.58%
jan 1, 1993
3.376 bln
-177.494 mln
-4.99%
jan 1, 1994
3.842 bln
+466.113 mln
13.81%
jan 1, 1995
4.032 bln
+189.68 mln
4.94%
jan 1, 1996
4.574 bln
+542.393 mln
13.45%
jan 1, 1997
4.338 bln
-236.046 mln
-5.16%
jan 1, 1998
4.111 bln
-227.577 mln
-5.25%
jan 1, 1999
4.383 bln
+272.822 mln
6.64%
jan 1, 2000
5.077 bln
+693.977 mln
15.83%
jan 1, 2001
4.302 bln
-775.081 mln
-15.27%
jan 1, 2002
4.737 bln
+434.549 mln
10.1%
jan 1, 2003
5.063 bln
+325.67 mln
6.88%
jan 1, 2004
6.372 bln
+1.31 bln
25.87%
jan 1, 2005
7.537 bln
+1.164 bln
18.27%
jan 1, 2006
7.461 bln
-75.491 mln
-1.0%
jan 1, 2007
7.902 bln
+441.134 mln
5.91%
jan 1, 2008
10.124 bln
+2.222 bln
28.12%
jan 1, 2009
11.851 bln
+1.726 bln
17.05%
jan 1, 2010
9.905 bln
-1.946 bln
-16.42%
jan 1, 2011
9.481 bln
-424.444 mln
-4.29%
jan 1, 2012
11.877 bln
+2.397 bln
25.28%
jan 1, 2013
11.287 bln
-590.516 mln
-4.97%
jan 1, 2014
10.905 bln
-381.612 mln
-3.38%
jan 1, 2015
12.064 bln
+1.158 bln
10.62%
jan 1, 2016
10.038 bln
-2.025 bln
-16.79%
Ranking of countries by current statistics by years


Comments: