29
/
en
AIzaSyAYiBZKx7MnpbEhh9jyipgxe19OcubqV5w
April 1, 2024
50063
Middle East & North Africa (IDA & IBRD countries)
TMN
false
2
1
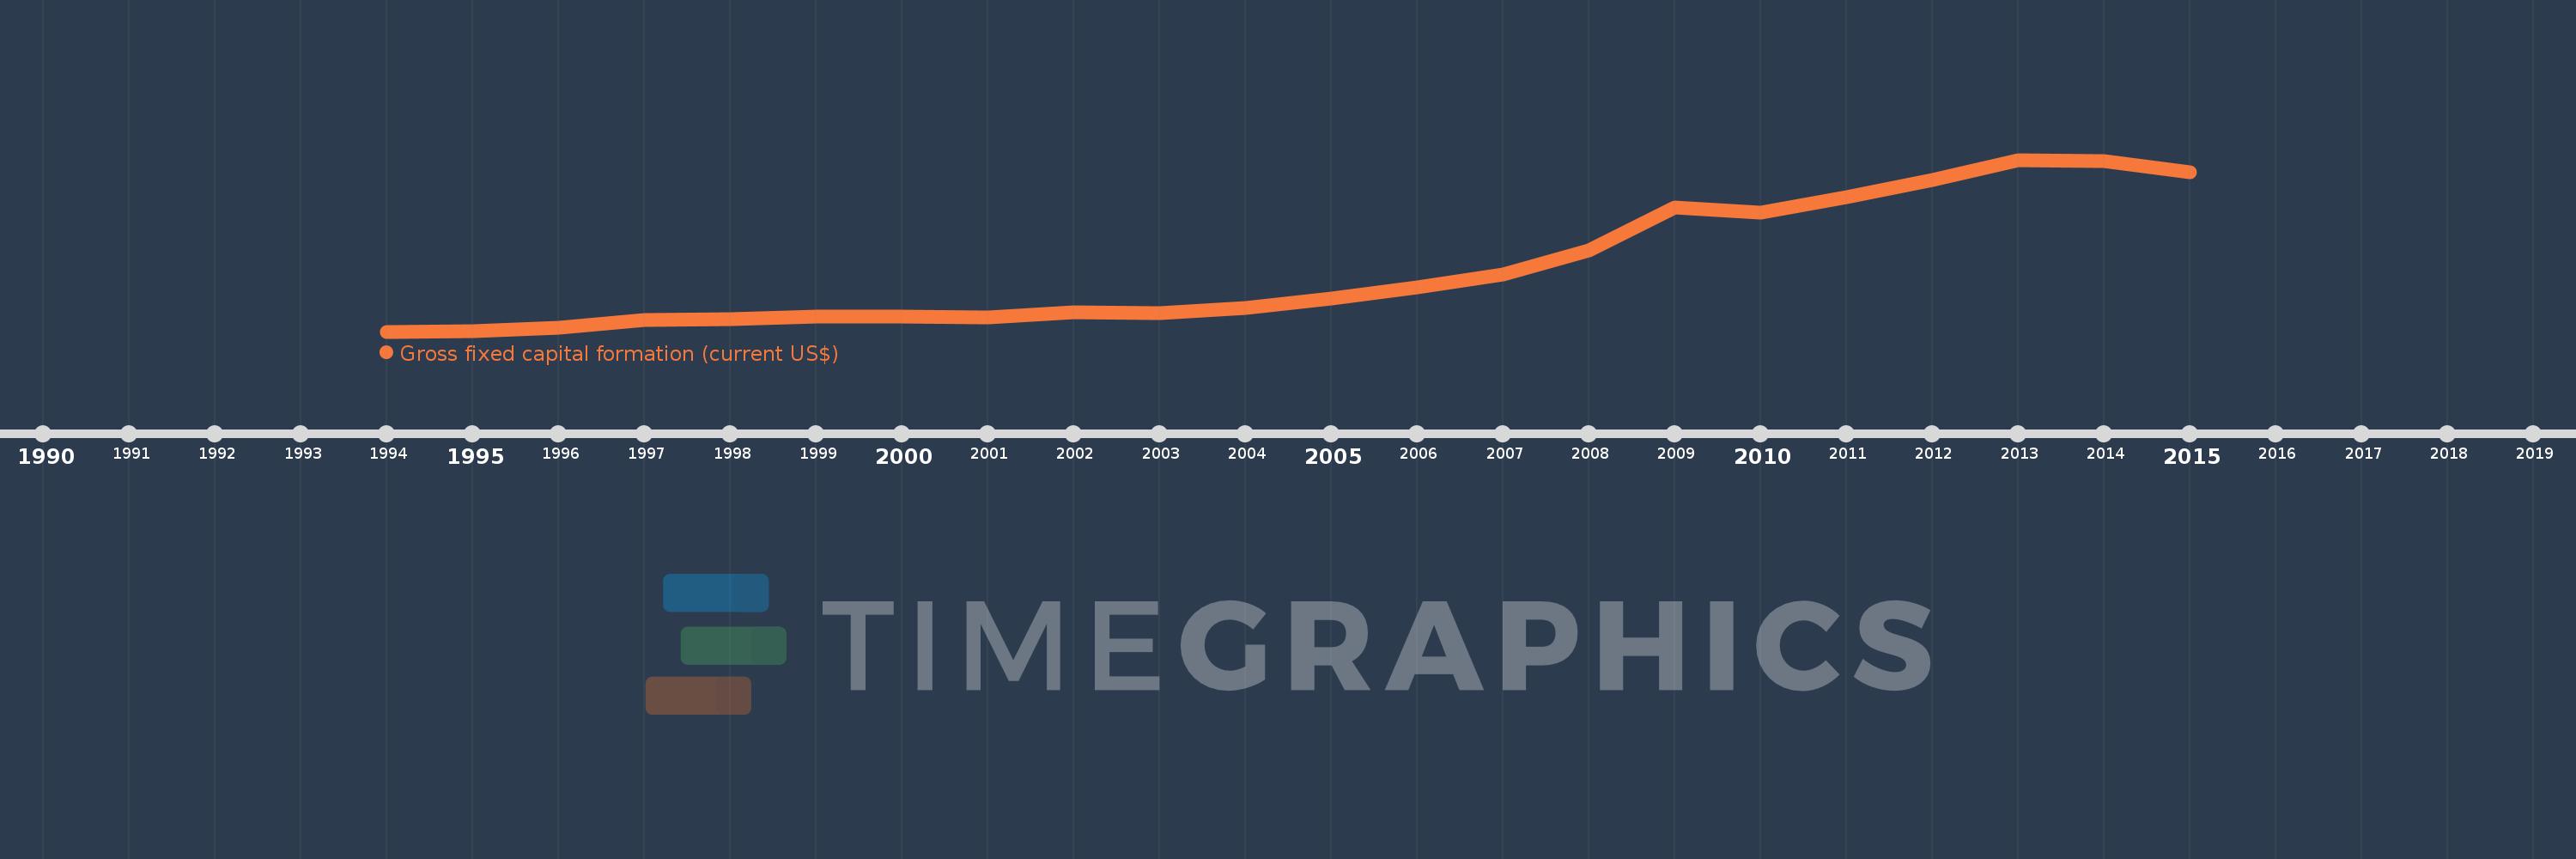
Gross fixed capital formation (current US$)
2015,2014,2013,2012,2011,2010,2009,2008,2007,2006,2005,2004,2003,2002,2001,2000,1999,1998,1997,1996,1995,1994
This statistics in other country:
AfghanistanAlbaniaAlgeriaAngolaAntigua and BarbudaArab WorldArgentinaArmeniaArubaAustraliaAustriaAzerbaijanBahamas, TheBahrainBangladeshBarbadosBelarusBelgiumBelizeBeninBermudaBhutanBoliviaBosnia and HerzegovinaBotswanaBrazilBrunei DarussalamBulgariaBurkina FasoBurundiCabo VerdeCambodiaCameroonCanadaCaribbean small statesCentral African RepublicCentral Europe and the BalticsChadChileChinaColombiaComorosCongo, Dem. Rep.Congo, Rep.Costa RicaCote d'IvoireCroatiaCubaCyprusCzech RepublicDenmarkDjiboutiDominicaDominican RepublicEarly-demographic dividendEast Asia & PacificEast Asia & Pacific (excluding high income)East Asia & Pacific (IDA & IBRD countries)EcuadorEgypt, Arab Rep.El SalvadorEquatorial GuineaEritreaEstoniaEthiopiaEuro areaEurope & Central AsiaEurope & Central Asia (excluding high income)Europe & Central Asia (IDA & IBRD countries)European UnionFijiFinlandFragile and conflict affected situationsFranceGabonGambia, TheGeorgiaGermanyGhanaGreeceGrenadaGuatemalaGuineaGuinea-BissauGuyanaHaitiHeavily indebted poor countries (HIPC)High incomeHondurasHong Kong SAR, ChinaHungaryIBRD onlyIcelandIDA & IBRD totalIDA blendIDA onlyIDA totalIndiaIndonesiaIran, Islamic Rep.IraqIrelandIsraelItalyJamaicaJapanJordanKazakhstanKenyaKiribatiKorea, Rep.KosovoKuwaitKyrgyz RepublicLao PDRLate-demographic dividendLatin America & Caribbean Latin America & Caribbean (excluding high income)Latin America & the Caribbean (IDA & IBRD countries)LatviaLeast developed countries: UN classificationLebanonLesothoLiberiaLibyaLithuaniaLow & middle incomeLow incomeLower middle incomeLuxembourgMacao SAR, ChinaMacedonia, FYRMadagascarMalawiMalaysiaMaldivesMaliMaltaMauritaniaMauritiusMexicoMicronesia, Fed. Sts.Middle East & North AfricaMiddle East & North Africa (excluding high income)Middle East & North Africa (IDA & IBRD countries)Middle incomeMoldovaMongoliaMontenegroMoroccoMozambiqueNamibiaNepalNetherlandsNew CaledoniaNew ZealandNicaraguaNigerNigeriaNorth AmericaNorwayOECD membersOmanPakistanPanamaPapua New GuineaParaguayPeruPhilippinesPolandPortugalPost-demographic dividendPre-demographic dividendPuerto RicoRomaniaRussian FederationRwandaSaudi ArabiaSenegalSerbiaSeychellesSierra LeoneSingaporeSlovak RepublicSloveniaSolomon IslandsSomaliaSouth AfricaSouth AsiaSouth Asia (IDA & IBRD)South SudanSpainSri LankaSt. Kitts and NevisSt. LuciaSt. Vincent and the GrenadinesSub-Saharan Africa Sub-Saharan Africa (excluding high income)Sub-Saharan Africa (IDA & IBRD countries)SudanSurinameSwazilandSwedenSwitzerlandSyrian Arab RepublicTajikistanTanzaniaThailandTimor-LesteTogoTongaTrinidad and TobagoTunisiaTurkeyTurkmenistanUgandaUkraineUnited Arab EmiratesUnited KingdomUnited StatesUpper middle incomeUruguayUzbekistanVanuatuVenezuela, RBVietnamWest Bank and GazaWorldYemen, Rep.ZambiaZimbabwe Timeline:
This timeline shows a graph from 1994 to 2015 of Middle East & North Africa (IDA & IBRD countries). No data until 1993. Number of actual observations by date: 22.
Source name:
World Development Indicators
Source organization:
World Bank national accounts data, and OECD National Accounts data files.
Categories, topics:
Economy & Growth
Last updated:
apr 23, 2017
Indicators value changes by year
Minimum:
65.731 bln
jan 1, 1994
Maximum:
425.428 bln
jan 1, 2013
At the date of observation
Value
Absolute change
Change from previous value
jan 1, 1994
65.731 bln
+65.731 bln
0.0%
jan 1, 1995
67.53 bln
+1.798 bln
2.74%
jan 1, 1996
74.616 bln
+7.086 bln
10.49%
jan 1, 1997
90.567 bln
+15.951 bln
21.38%
jan 1, 1998
91.212 bln
+645.268 mln
0.71%
jan 1, 1999
96.482 bln
+5.27 bln
5.78%
jan 1, 2000
97.314 bln
+831.324 mln
0.86%
jan 1, 2001
95.649 bln
-1.665 bln
-1.71%
jan 1, 2002
106.427 bln
+10.778 bln
11.27%
jan 1, 2003
103.973 bln
-2.454 bln
-2.31%
jan 1, 2004
116.01 bln
+12.037 bln
11.58%
jan 1, 2005
135.025 bln
+19.015 bln
16.39%
jan 1, 2006
157.582 bln
+22.557 bln
16.71%
jan 1, 2007
185.34 bln
+27.757 bln
17.61%
jan 1, 2008
235.181 bln
+49.841 bln
26.89%
jan 1, 2009
325.337 bln
+90.157 bln
38.33%
jan 1, 2010
313.993 bln
-11.344 bln
-3.49%
jan 1, 2011
347.45 bln
+33.457 bln
10.66%
jan 1, 2012
383.315 bln
+35.865 bln
10.32%
jan 1, 2013
425.428 bln
+42.113 bln
10.99%
jan 1, 2014
422.132 bln
-3.296 bln
-0.77%
jan 1, 2015
398.493 bln
-23.639 bln
-5.6%
Ranking of countries by current statistics by years


Comments: