29
/
en
AIzaSyAYiBZKx7MnpbEhh9jyipgxe19OcubqV5w
April 1, 2024
156052
Indonesia
IDN
true
2
1
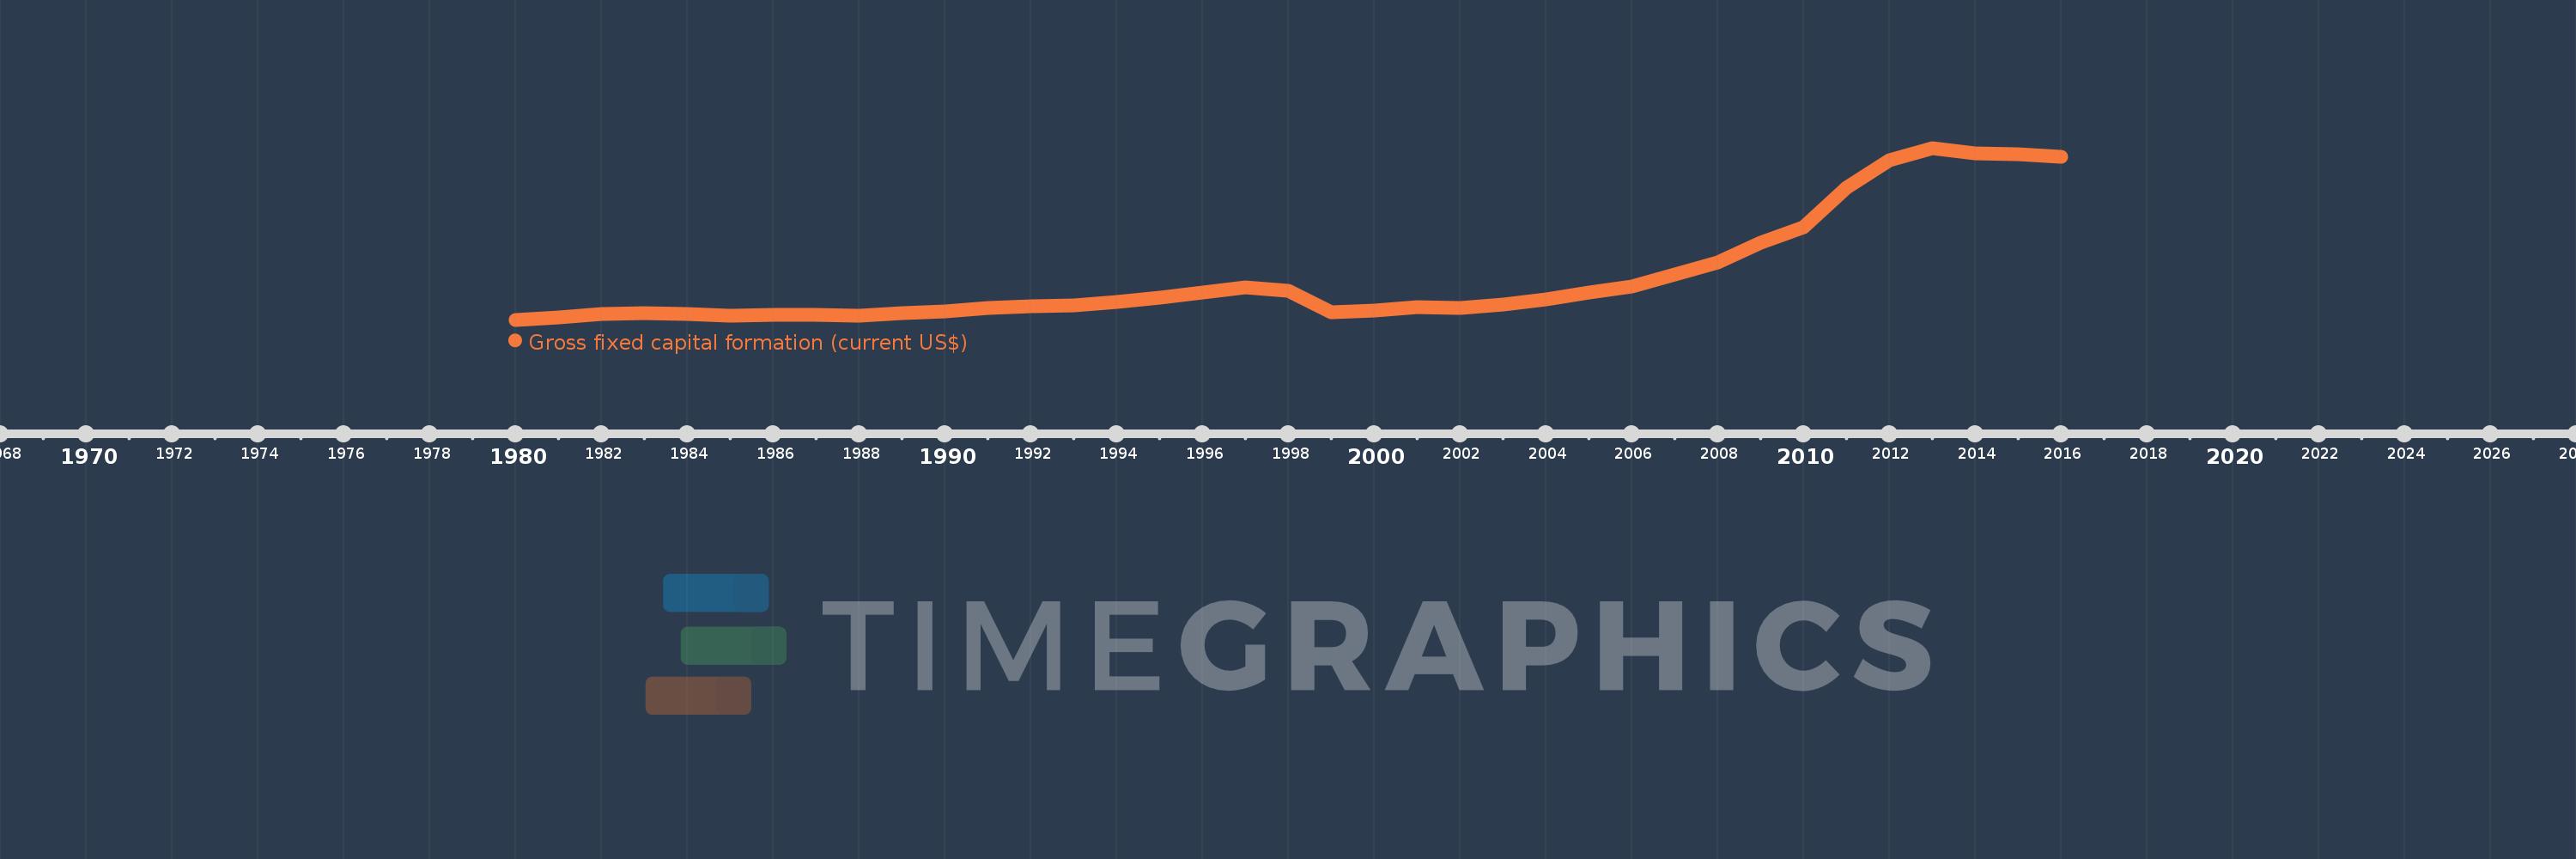
Gross fixed capital formation (current US$)
2016,2015,2014,2013,2012,2011,2010,2009,2008,2007,2006,2005,2004,2003,2002,2001,2000,1999,1998,1997,1996,1995,1994,1993,1992,1991,1990,1989,1988,1987,1986,1985,1984,1983,1982,1981,1980
This statistics in other country:
AfghanistanAlbaniaAlgeriaAngolaAntigua and BarbudaArab WorldArgentinaArmeniaArubaAustraliaAustriaAzerbaijanBahamas, TheBahrainBangladeshBarbadosBelarusBelgiumBelizeBeninBermudaBhutanBoliviaBosnia and HerzegovinaBotswanaBrazilBrunei DarussalamBulgariaBurkina FasoBurundiCabo VerdeCambodiaCameroonCanadaCaribbean small statesCentral African RepublicCentral Europe and the BalticsChadChileChinaColombiaComorosCongo, Dem. Rep.Congo, Rep.Costa RicaCote d'IvoireCroatiaCubaCyprusCzech RepublicDenmarkDjiboutiDominicaDominican RepublicEarly-demographic dividendEast Asia & PacificEast Asia & Pacific (excluding high income)East Asia & Pacific (IDA & IBRD countries)EcuadorEgypt, Arab Rep.El SalvadorEquatorial GuineaEritreaEstoniaEthiopiaEuro areaEurope & Central AsiaEurope & Central Asia (excluding high income)Europe & Central Asia (IDA & IBRD countries)European UnionFijiFinlandFragile and conflict affected situationsFranceGabonGambia, TheGeorgiaGermanyGhanaGreeceGrenadaGuatemalaGuineaGuinea-BissauGuyanaHaitiHeavily indebted poor countries (HIPC)High incomeHondurasHong Kong SAR, ChinaHungaryIBRD onlyIcelandIDA & IBRD totalIDA blendIDA onlyIDA totalIndiaIndonesiaIran, Islamic Rep.IraqIrelandIsraelItalyJamaicaJapanJordanKazakhstanKenyaKiribatiKorea, Rep.KosovoKuwaitKyrgyz RepublicLao PDRLate-demographic dividendLatin America & Caribbean Latin America & Caribbean (excluding high income)Latin America & the Caribbean (IDA & IBRD countries)LatviaLeast developed countries: UN classificationLebanonLesothoLiberiaLibyaLithuaniaLow & middle incomeLow incomeLower middle incomeLuxembourgMacao SAR, ChinaMacedonia, FYRMadagascarMalawiMalaysiaMaldivesMaliMaltaMauritaniaMauritiusMexicoMicronesia, Fed. Sts.Middle East & North AfricaMiddle East & North Africa (excluding high income)Middle East & North Africa (IDA & IBRD countries)Middle incomeMoldovaMongoliaMontenegroMoroccoMozambiqueNamibiaNepalNetherlandsNew CaledoniaNew ZealandNicaraguaNigerNigeriaNorth AmericaNorwayOECD membersOmanPakistanPanamaPapua New GuineaParaguayPeruPhilippinesPolandPortugalPost-demographic dividendPre-demographic dividendPuerto RicoRomaniaRussian FederationRwandaSaudi ArabiaSenegalSerbiaSeychellesSierra LeoneSingaporeSlovak RepublicSloveniaSolomon IslandsSomaliaSouth AfricaSouth AsiaSouth Asia (IDA & IBRD)South SudanSpainSri LankaSt. Kitts and NevisSt. LuciaSt. Vincent and the GrenadinesSub-Saharan Africa Sub-Saharan Africa (excluding high income)Sub-Saharan Africa (IDA & IBRD countries)SudanSurinameSwazilandSwedenSwitzerlandSyrian Arab RepublicTajikistanTanzaniaThailandTimor-LesteTogoTongaTrinidad and TobagoTunisiaTurkeyTurkmenistanUgandaUkraineUnited Arab EmiratesUnited KingdomUnited StatesUpper middle incomeUruguayUzbekistanVanuatuVenezuela, RBVietnamWest Bank and GazaWorldYemen, Rep.ZambiaZimbabwe Timeline:
This timeline shows a graph from 1980 to 2016 of Indonesia. No data until 1979. Number of actual observations by date: 37.
Source name:
World Development Indicators
Source organization:
World Bank national accounts data, and OECD National Accounts data files.
Categories, topics:
Economy & Growth
Last updated:
apr 23, 2017
Indicators value changes by year
Minimum:
12.307 bln
jan 1, 1980
Maximum:
300.324 bln
jan 1, 2013
At the date of observation
Value
Absolute change
Change from previous value
jan 1, 1980
12.307 bln
+12.307 bln
0.0%
jan 1, 1981
16.826 bln
+4.519 bln
36.72%
jan 1, 1982
22.373 bln
+5.547 bln
32.97%
jan 1, 1983
23.922 bln
+1.549 bln
6.92%
jan 1, 1984
21.471 bln
-2.451 bln
-10.24%
jan 1, 1985
19.341 bln
-2.13 bln
-9.92%
jan 1, 1986
19.846 bln
+505.316 mln
2.61%
jan 1, 1987
20.429 bln
+582.946 mln
2.94%
jan 1, 1988
19.112 bln
-1.317 bln
-6.45%
jan 1, 1989
22.754 bln
+3.642 bln
19.05%
jan 1, 1990
26.952 bln
+4.198 bln
18.45%
jan 1, 1991
32.428 bln
+5.476 bln
20.32%
jan 1, 1992
34.604 bln
+2.176 bln
6.71%
jan 1, 1993
35.851 bln
+1.247 bln
3.6%
jan 1, 1994
41.525 bln
+5.675 bln
15.83%
jan 1, 1995
48.77 bln
+7.245 bln
17.45%
jan 1, 1996
57.466 bln
+8.695 bln
17.83%
jan 1, 1997
67.307 bln
+9.841 bln
17.13%
jan 1, 1998
61.074 bln
-6.233 bln
-9.26%
jan 1, 1999
24.271 bln
-36.802 bln
-60.26%
jan 1, 2000
28.195 bln
+3.923 bln
16.16%
jan 1, 2001
32.758 bln
+4.564 bln
16.19%
jan 1, 2002
31.564 bln
-1.194 bln
-3.64%
jan 1, 2003
38.015 bln
+6.451 bln
20.44%
jan 1, 2004
45.795 bln
+7.78 bln
20.46%
jan 1, 2005
57.656 bln
+11.861 bln
25.9%
jan 1, 2006
67.581 bln
+9.924 bln
17.21%
jan 1, 2007
87.974 bln
+20.394 bln
30.18%
jan 1, 2008
107.825 bln
+19.85 bln
22.56%
jan 1, 2009
141.326 bln
+33.501 bln
31.07%
jan 1, 2010
167.889 bln
+26.563 bln
18.8%
jan 1, 2011
234.075 bln
+66.186 bln
39.42%
jan 1, 2012
279.566 bln
+45.491 bln
19.43%
jan 1, 2013
300.324 bln
+20.758 bln
7.42%
jan 1, 2014
291.695 bln
-8.628 bln
-2.87%
jan 1, 2015
290.094 bln
-1.601 bln
-0.55%
jan 1, 2016
286.045 bln
-4.049 bln
-1.4%
Ranking of countries by current statistics by years


Comments: