29
/
en
AIzaSyAYiBZKx7MnpbEhh9jyipgxe19OcubqV5w
April 1, 2024
25742
Central Europe and the Baltics
CEB
false
2
1
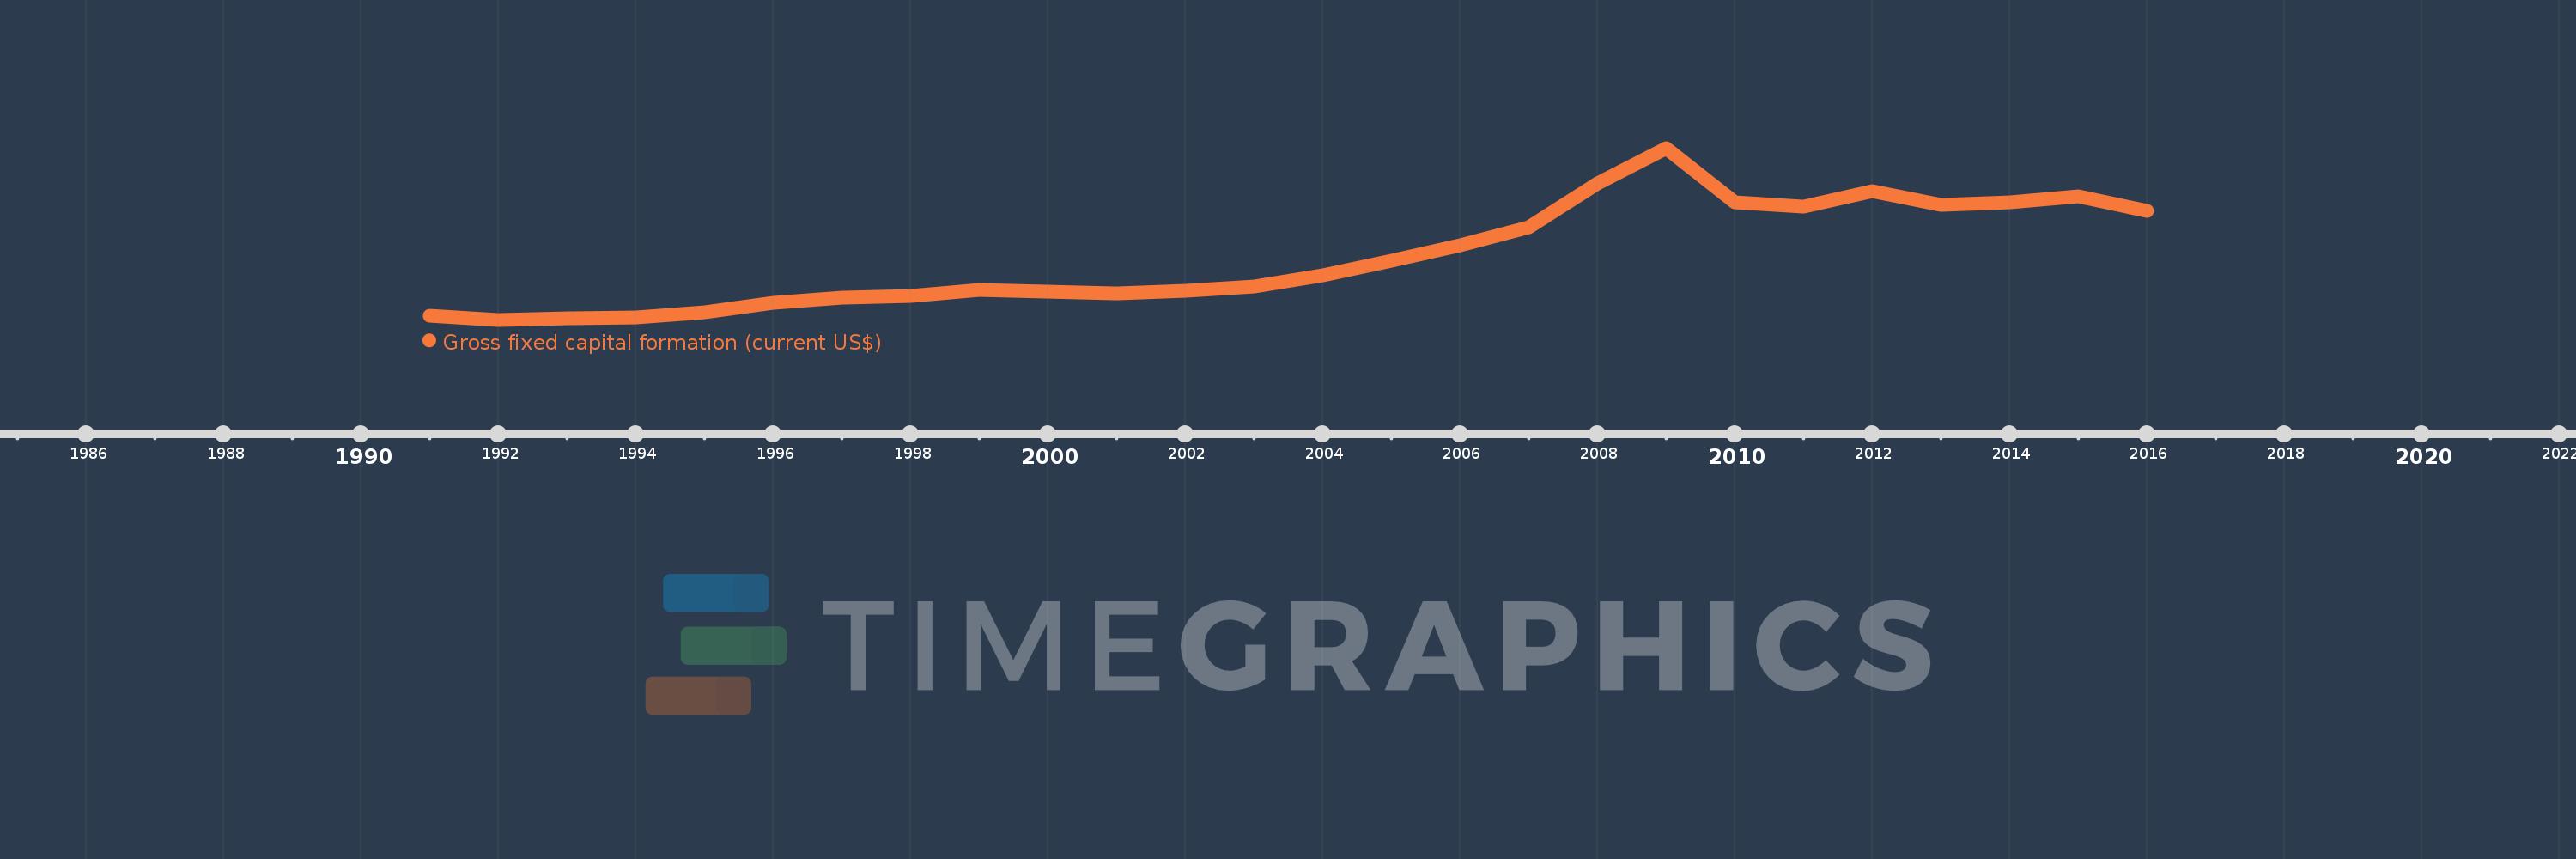
Gross fixed capital formation (current US$)
2016,2015,2014,2013,2012,2011,2010,2009,2008,2007,2006,2005,2004,2003,2002,2001,2000,1999,1998,1997,1996,1995,1994,1993,1992,1991
This statistics in other country:
AfghanistanAlbaniaAlgeriaAngolaAntigua and BarbudaArab WorldArgentinaArmeniaArubaAustraliaAustriaAzerbaijanBahamas, TheBahrainBangladeshBarbadosBelarusBelgiumBelizeBeninBermudaBhutanBoliviaBosnia and HerzegovinaBotswanaBrazilBrunei DarussalamBulgariaBurkina FasoBurundiCabo VerdeCambodiaCameroonCanadaCaribbean small statesCentral African RepublicCentral Europe and the BalticsChadChileChinaColombiaComorosCongo, Dem. Rep.Congo, Rep.Costa RicaCote d'IvoireCroatiaCubaCyprusCzech RepublicDenmarkDjiboutiDominicaDominican RepublicEarly-demographic dividendEast Asia & PacificEast Asia & Pacific (excluding high income)East Asia & Pacific (IDA & IBRD countries)EcuadorEgypt, Arab Rep.El SalvadorEquatorial GuineaEritreaEstoniaEthiopiaEuro areaEurope & Central AsiaEurope & Central Asia (excluding high income)Europe & Central Asia (IDA & IBRD countries)European UnionFijiFinlandFragile and conflict affected situationsFranceGabonGambia, TheGeorgiaGermanyGhanaGreeceGrenadaGuatemalaGuineaGuinea-BissauGuyanaHaitiHeavily indebted poor countries (HIPC)High incomeHondurasHong Kong SAR, ChinaHungaryIBRD onlyIcelandIDA & IBRD totalIDA blendIDA onlyIDA totalIndiaIndonesiaIran, Islamic Rep.IraqIrelandIsraelItalyJamaicaJapanJordanKazakhstanKenyaKiribatiKorea, Rep.KosovoKuwaitKyrgyz RepublicLao PDRLate-demographic dividendLatin America & Caribbean Latin America & Caribbean (excluding high income)Latin America & the Caribbean (IDA & IBRD countries)LatviaLeast developed countries: UN classificationLebanonLesothoLiberiaLibyaLithuaniaLow & middle incomeLow incomeLower middle incomeLuxembourgMacao SAR, ChinaMacedonia, FYRMadagascarMalawiMalaysiaMaldivesMaliMaltaMauritaniaMauritiusMexicoMicronesia, Fed. Sts.Middle East & North AfricaMiddle East & North Africa (excluding high income)Middle East & North Africa (IDA & IBRD countries)Middle incomeMoldovaMongoliaMontenegroMoroccoMozambiqueNamibiaNepalNetherlandsNew CaledoniaNew ZealandNicaraguaNigerNigeriaNorth AmericaNorwayOECD membersOmanPakistanPanamaPapua New GuineaParaguayPeruPhilippinesPolandPortugalPost-demographic dividendPre-demographic dividendPuerto RicoRomaniaRussian FederationRwandaSaudi ArabiaSenegalSerbiaSeychellesSierra LeoneSingaporeSlovak RepublicSloveniaSolomon IslandsSomaliaSouth AfricaSouth AsiaSouth Asia (IDA & IBRD)South SudanSpainSri LankaSt. Kitts and NevisSt. LuciaSt. Vincent and the GrenadinesSub-Saharan Africa Sub-Saharan Africa (excluding high income)Sub-Saharan Africa (IDA & IBRD countries)SudanSurinameSwazilandSwedenSwitzerlandSyrian Arab RepublicTajikistanTanzaniaThailandTimor-LesteTogoTongaTrinidad and TobagoTunisiaTurkeyTurkmenistanUgandaUkraineUnited Arab EmiratesUnited KingdomUnited StatesUpper middle incomeUruguayUzbekistanVanuatuVenezuela, RBVietnamWest Bank and GazaWorldYemen, Rep.ZambiaZimbabwe Timeline:
This timeline shows a graph from 1991 to 2016 of Central Europe and the Baltics. No data until 1990. Number of actual observations by date: 26.
Source name:
World Development Indicators
Source organization:
World Bank national accounts data, and OECD National Accounts data files.
Categories, topics:
Economy & Growth
Last updated:
apr 23, 2017
Indicators value changes by year
Minimum:
47.821 bln
jan 1, 1992
Maximum:
419.358 bln
jan 1, 2009
At the date of observation
Value
Absolute change
Change from previous value
jan 1, 1991
57.182 bln
+57.182 bln
0.0%
jan 1, 1992
47.821 bln
-9.361 bln
-16.37%
jan 1, 1993
51.328 bln
+3.507 bln
7.33%
jan 1, 1994
52.357 bln
+1.029 bln
2.0%
jan 1, 1995
63.746 bln
+11.39 bln
21.75%
jan 1, 1996
83.531 bln
+19.785 bln
31.04%
jan 1, 1997
96.481 bln
+12.95 bln
15.5%
jan 1, 1998
100.052 bln
+3.571 bln
3.7%
jan 1, 1999
112.322 bln
+12.269 bln
12.26%
jan 1, 2000
107.742 bln
-4.579 bln
-4.08%
jan 1, 2001
104.68 bln
-3.063 bln
-2.84%
jan 1, 2002
110.201 bln
+5.521 bln
5.27%
jan 1, 2003
119.925 bln
+9.724 bln
8.82%
jan 1, 2004
144.491 bln
+24.567 bln
20.48%
jan 1, 2005
174.932 bln
+30.441 bln
21.07%
jan 1, 2006
209.464 bln
+34.532 bln
19.74%
jan 1, 2007
248.0 bln
+38.536 bln
18.4%
jan 1, 2008
343.293 bln
+95.293 bln
38.42%
jan 1, 2009
419.358 bln
+76.065 bln
22.16%
jan 1, 2010
302.139 bln
-117.218 bln
-27.95%
jan 1, 2011
292.067 bln
-10.073 bln
-3.33%
jan 1, 2012
326.543 bln
+34.477 bln
11.8%
jan 1, 2013
296.783 bln
-29.76 bln
-9.11%
jan 1, 2014
302.298 bln
+5.514 bln
1.86%
jan 1, 2015
314.429 bln
+12.131 bln
4.01%
jan 1, 2016
283.033 bln
-31.396 bln
-9.98%
Ranking of countries by current statistics by years


Comments: