29
/
en
AIzaSyAYiBZKx7MnpbEhh9jyipgxe19OcubqV5w
April 1, 2024
171762
Kuwait
KWT
true
2
1
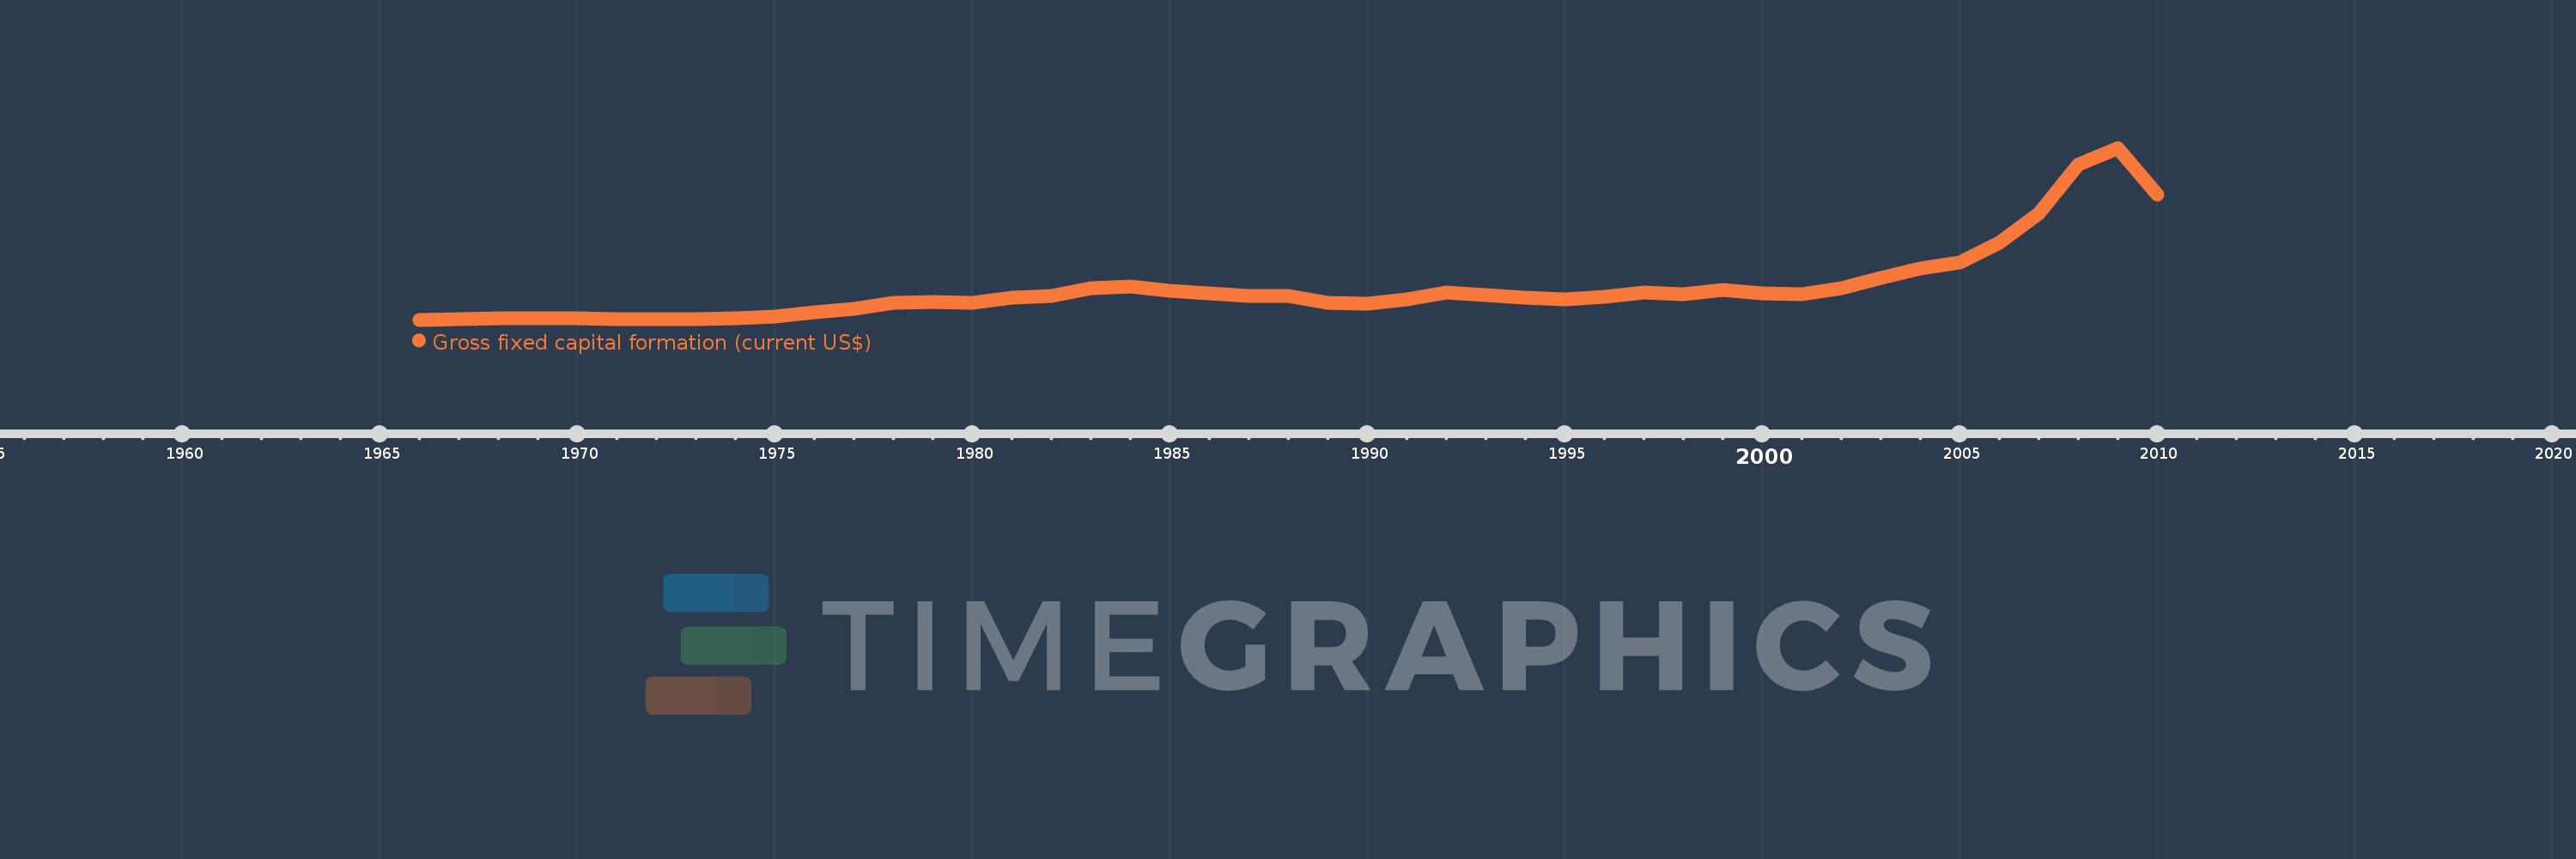
Gross fixed capital formation (current US$)
2010,2009,2008,2007,2006,2005,2004,2003,2002,2001,2000,1999,1998,1997,1996,1995,1994,1993,1992,1991,1990,1989,1988,1987,1986,1985,1984,1983,1982,1981,1980,1979,1978,1977,1976,1975,1974,1973,1972,1971,1970,1969,1968,1967,1966
This statistics in other country:
AfghanistanAlbaniaAlgeriaAngolaAntigua and BarbudaArab WorldArgentinaArmeniaArubaAustraliaAustriaAzerbaijanBahamas, TheBahrainBangladeshBarbadosBelarusBelgiumBelizeBeninBermudaBhutanBoliviaBosnia and HerzegovinaBotswanaBrazilBrunei DarussalamBulgariaBurkina FasoBurundiCabo VerdeCambodiaCameroonCanadaCaribbean small statesCentral African RepublicCentral Europe and the BalticsChadChileChinaColombiaComorosCongo, Dem. Rep.Congo, Rep.Costa RicaCote d'IvoireCroatiaCubaCyprusCzech RepublicDenmarkDjiboutiDominicaDominican RepublicEarly-demographic dividendEast Asia & PacificEast Asia & Pacific (excluding high income)East Asia & Pacific (IDA & IBRD countries)EcuadorEgypt, Arab Rep.El SalvadorEquatorial GuineaEritreaEstoniaEthiopiaEuro areaEurope & Central AsiaEurope & Central Asia (excluding high income)Europe & Central Asia (IDA & IBRD countries)European UnionFijiFinlandFragile and conflict affected situationsFranceGabonGambia, TheGeorgiaGermanyGhanaGreeceGrenadaGuatemalaGuineaGuinea-BissauGuyanaHaitiHeavily indebted poor countries (HIPC)High incomeHondurasHong Kong SAR, ChinaHungaryIBRD onlyIcelandIDA & IBRD totalIDA blendIDA onlyIDA totalIndiaIndonesiaIran, Islamic Rep.IraqIrelandIsraelItalyJamaicaJapanJordanKazakhstanKenyaKiribatiKorea, Rep.KosovoKuwaitKyrgyz RepublicLao PDRLate-demographic dividendLatin America & Caribbean Latin America & Caribbean (excluding high income)Latin America & the Caribbean (IDA & IBRD countries)LatviaLeast developed countries: UN classificationLebanonLesothoLiberiaLibyaLithuaniaLow & middle incomeLow incomeLower middle incomeLuxembourgMacao SAR, ChinaMacedonia, FYRMadagascarMalawiMalaysiaMaldivesMaliMaltaMauritaniaMauritiusMexicoMicronesia, Fed. Sts.Middle East & North AfricaMiddle East & North Africa (excluding high income)Middle East & North Africa (IDA & IBRD countries)Middle incomeMoldovaMongoliaMontenegroMoroccoMozambiqueNamibiaNepalNetherlandsNew CaledoniaNew ZealandNicaraguaNigerNigeriaNorth AmericaNorwayOECD membersOmanPakistanPanamaPapua New GuineaParaguayPeruPhilippinesPolandPortugalPost-demographic dividendPre-demographic dividendPuerto RicoRomaniaRussian FederationRwandaSaudi ArabiaSenegalSerbiaSeychellesSierra LeoneSingaporeSlovak RepublicSloveniaSolomon IslandsSomaliaSouth AfricaSouth AsiaSouth Asia (IDA & IBRD)South SudanSpainSri LankaSt. Kitts and NevisSt. LuciaSt. Vincent and the GrenadinesSub-Saharan Africa Sub-Saharan Africa (excluding high income)Sub-Saharan Africa (IDA & IBRD countries)SudanSurinameSwazilandSwedenSwitzerlandSyrian Arab RepublicTajikistanTanzaniaThailandTimor-LesteTogoTongaTrinidad and TobagoTunisiaTurkeyTurkmenistanUgandaUkraineUnited Arab EmiratesUnited KingdomUnited StatesUpper middle incomeUruguayUzbekistanVanuatuVenezuela, RBVietnamWest Bank and GazaWorldYemen, Rep.ZambiaZimbabwe Timeline:
This timeline shows a graph from 1966 to 2010 of Kuwait. No data until 1965. Number of actual observations by date: 45.
Source name:
World Development Indicators
Source organization:
World Bank national accounts data, and OECD National Accounts data files.
Categories, topics:
Economy & Growth
Last updated:
apr 23, 2017
Indicators value changes by year
Minimum:
266.032 mln
jan 1, 1966
Maximum:
25.986 bln
jan 1, 2009
At the date of observation
Value
Absolute change
Change from previous value
jan 1, 1966
266.032 mln
+266.032 mln
0.0%
jan 1, 1967
378.045 mln
+112.013 mln
42.11%
jan 1, 1968
456.455 mln
+78.409 mln
20.74%
jan 1, 1969
439.653 mln
-16.802 mln
-3.68%
jan 1, 1970
476.057 mln
+36.404 mln
8.28%
jan 1, 1971
354.243 mln
-121.815 mln
-25.59%
jan 1, 1972
355.518 mln
+1.276 mln
0.36%
jan 1, 1973
387.048 mln
+31.53 mln
8.87%
jan 1, 1974
491.571 mln
+104.523 mln
27.01%
jan 1, 1975
756.139 mln
+264.568 mln
53.82%
jan 1, 1976
1.44 bln
+683.861 mln
90.44%
jan 1, 1977
1.926 bln
+485.787 mln
33.74%
jan 1, 1978
2.844 bln
+918.596 mln
47.7%
jan 1, 1979
2.886 bln
+41.477 mln
1.46%
jan 1, 1980
2.857 bln
-29.13 mln
-1.01%
jan 1, 1981
3.598 bln
+741.495 mln
25.96%
jan 1, 1982
3.848 bln
+249.695 mln
6.94%
jan 1, 1983
4.988 bln
+1.14 bln
29.62%
jan 1, 1984
5.239 bln
+250.682 mln
5.03%
jan 1, 1985
4.59 bln
-648.927 mln
-12.39%
jan 1, 1986
4.245 bln
-344.884 mln
-7.51%
jan 1, 1987
3.878 bln
-366.634 mln
-8.64%
jan 1, 1988
3.79 bln
-88.342 mln
-2.28%
jan 1, 1989
2.831 bln
-958.699 mln
-25.3%
jan 1, 1990
2.628 bln
-203.061 mln
-7.17%
jan 1, 1991
3.322 bln
+694.244 mln
26.42%
jan 1, 1992
4.326 bln
+1.004 bln
30.23%
jan 1, 1993
3.947 bln
-379.585 mln
-8.77%
jan 1, 1994
3.623 bln
-324.314 mln
-8.22%
jan 1, 1995
3.306 bln
-316.119 mln
-8.73%
jan 1, 1996
3.686 bln
+379.93 mln
11.49%
jan 1, 1997
4.402 bln
+715.811 mln
19.42%
jan 1, 1998
4.088 bln
-313.776 mln
-7.13%
jan 1, 1999
4.751 bln
+662.295 mln
16.2%
jan 1, 2000
4.271 bln
-479.96 mln
-10.1%
jan 1, 2001
4.022 bln
-248.532 mln
-5.82%
jan 1, 2002
4.992 bln
+969.684 mln
24.11%
jan 1, 2003
6.532 bln
+1.54 bln
30.85%
jan 1, 2004
7.963 bln
+1.431 bln
21.91%
jan 1, 2005
8.904 bln
+940.883 mln
11.82%
jan 1, 2006
11.818 bln
+2.915 bln
32.73%
jan 1, 2007
16.185 bln
+4.367 bln
36.95%
jan 1, 2008
23.452 bln
+7.266 bln
44.89%
jan 1, 2009
25.986 bln
+2.534 bln
10.81%
jan 1, 2010
19.038 bln
-6.948 bln
-26.74%
Ranking of countries by current statistics by years


Comments: