29
/
en
AIzaSyAYiBZKx7MnpbEhh9jyipgxe19OcubqV5w
April 1, 2024
54375
Pacific island small states
PSS
false
2
1
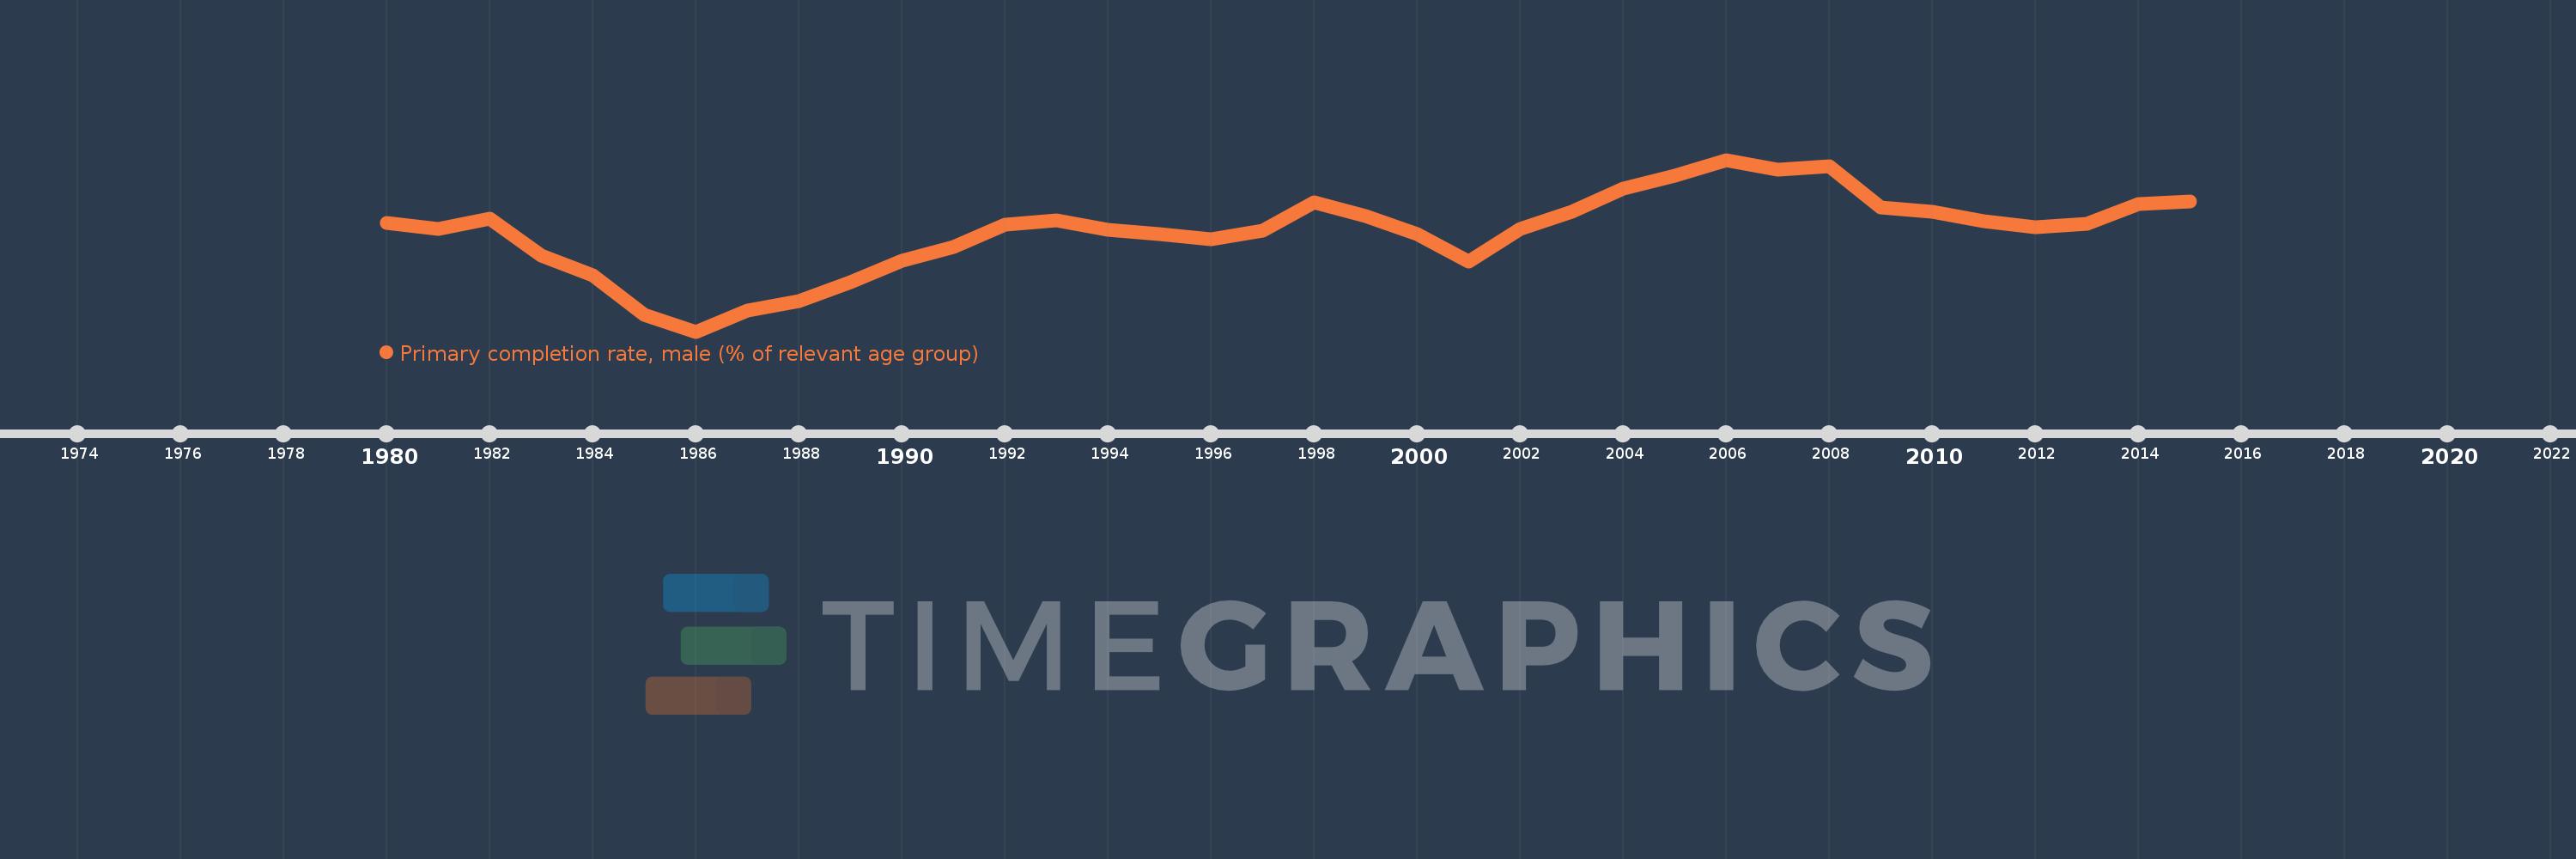
Primary completion rate, male (% of relevant age group)
2015,2014,2013,2012,2011,2010,2009,2008,2007,2006,2005,2004,2003,2002,2001,2000,1999,1998,1997,1996,1995,1994,1993,1992,1991,1990,1989,1988,1987,1986,1985,1984,1983,1982,1981,1980
This statistics in other country:
AfghanistanAlbaniaAlgeriaAngolaAntigua and BarbudaArab WorldArgentinaArmeniaArubaAustriaAzerbaijanBahamas, TheBahrainBangladeshBarbadosBelarusBelgiumBelizeBeninBermudaBhutanBoliviaBosnia and HerzegovinaBotswanaBrunei DarussalamBulgariaBurkina FasoBurundiCabo VerdeCambodiaCameroonCanadaCaribbean small statesCentral African RepublicCentral Europe and the BalticsChadChileChinaColombiaComorosCongo, Dem. Rep.Congo, Rep.Costa RicaCote d'IvoireCroatiaCubaCyprusCzech RepublicDenmarkDjiboutiDominicaDominican RepublicEarly-demographic dividendEast Asia & PacificEast Asia & Pacific (excluding high income)East Asia & Pacific (IDA & IBRD countries)EcuadorEgypt, Arab Rep.El SalvadorEquatorial GuineaEritreaEstoniaEthiopiaEuro areaEurope & Central AsiaEurope & Central Asia (excluding high income)Europe & Central Asia (IDA & IBRD countries)European UnionFijiFinlandFragile and conflict affected situationsFranceGabonGambia, TheGeorgiaGermanyGhanaGreeceGrenadaGuatemalaGuineaGuinea-BissauGuyanaHaitiHeavily indebted poor countries (HIPC)High incomeHondurasHong Kong SAR, ChinaHungaryIBRD onlyIcelandIDA & IBRD totalIDA blendIDA onlyIDA totalIndiaIndonesiaIran, Islamic Rep.IraqIrelandIsraelItalyJamaicaJapanJordanKazakhstanKenyaKiribatiKorea, Dem. People’s Rep.Korea, Rep.KuwaitKyrgyz RepublicLao PDRLate-demographic dividendLatin America & Caribbean Latin America & Caribbean (excluding high income)Latin America & the Caribbean (IDA & IBRD countries)LatviaLeast developed countries: UN classificationLebanonLesothoLiberiaLibyaLiechtensteinLithuaniaLow & middle incomeLow incomeLower middle incomeLuxembourgMacao SAR, ChinaMacedonia, FYRMadagascarMalawiMaldivesMaliMaltaMarshall IslandsMauritaniaMauritiusMexicoMiddle East & North AfricaMiddle East & North Africa (excluding high income)Middle East & North Africa (IDA & IBRD countries)Middle incomeMoldovaMongoliaMontenegroMoroccoMozambiqueMyanmarNamibiaNauruNepalNetherlandsNew ZealandNicaraguaNigerNigeriaNorwayOECD membersOmanOther small statesPacific island small statesPakistanPalauPanamaPapua New GuineaParaguayPeruPhilippinesPolandPortugalPost-demographic dividendPre-demographic dividendQatarRomaniaRussian FederationRwandaSamoaSan MarinoSao Tome and PrincipeSaudi ArabiaSenegalSerbiaSeychellesSierra LeoneSlovak RepublicSloveniaSmall statesSolomon IslandsSouth AfricaSouth AsiaSouth Asia (IDA & IBRD)South SudanSpainSri LankaSt. Kitts and NevisSt. LuciaSt. Vincent and the GrenadinesSub-Saharan Africa Sub-Saharan Africa (excluding high income)Sub-Saharan Africa (IDA & IBRD countries)SudanSurinameSwazilandSwedenSwitzerlandSyrian Arab RepublicTajikistanTanzaniaThailandTimor-LesteTogoTongaTrinidad and TobagoTunisiaTurkeyTuvaluUgandaUkraineUnited Arab EmiratesUpper middle incomeUruguayUzbekistanVanuatuVenezuela, RBVietnamWest Bank and GazaWorldYemen, Rep.ZambiaZimbabwe Timeline:
This timeline shows a graph from 1980 to 2015 of Pacific island small states. No data until 1979. Number of actual observations by date: 36.
Source name:
World Development Indicators
Source organization:
United Nations Educational, Scientific, and Cultural Organization (UNESCO) Institute for Statistics.
Categories, topics:
Education, Gender
Last updated:
apr 23, 2017
Indicators value changes by year
Minimum:
87.664
jan 1, 1986
Maximum:
100.246
jan 1, 2006
At the date of observation
Value
Absolute change
Change from previous value
jan 1, 1980
95.618
+95.618
0.0%
jan 1, 1981
95.176
-0.442
-0.46%
jan 1, 1982
95.927
+0.751
0.79%
jan 1, 1983
93.21
-2.717
-2.83%
jan 1, 1984
91.812
-1.398
-1.5%
jan 1, 1985
88.897
-2.915
-3.18%
jan 1, 1986
87.664
-1.233
-1.39%
jan 1, 1987
89.231
+1.567
1.79%
jan 1, 1988
89.902
+0.671
0.75%
jan 1, 1989
91.263
+1.361
1.51%
jan 1, 1990
92.865
+1.602
1.76%
jan 1, 1991
93.872
+1.006
1.08%
jan 1, 1992
95.497
+1.626
1.73%
jan 1, 1993
95.787
+0.29
0.3%
jan 1, 1994
95.139
-0.649
-0.68%
jan 1, 1995
94.824
-0.314
-0.33%
jan 1, 1996
94.412
-0.412
-0.43%
jan 1, 1997
95.077
+0.665
0.7%
jan 1, 1998
97.128
+2.052
2.16%
jan 1, 1999
96.099
-1.029
-1.06%
jan 1, 2000
94.774
-1.325
-1.38%
jan 1, 2001
92.818
-1.957
-2.06%
jan 1, 2002
95.152
+2.334
2.51%
jan 1, 2003
96.47
+1.318
1.39%
jan 1, 2004
98.108
+1.638
1.7%
jan 1, 2005
99.072
+0.964
0.98%
jan 1, 2006
100.246
+1.173
1.18%
jan 1, 2007
99.537
-0.708
-0.71%
jan 1, 2008
99.795
+0.258
0.26%
jan 1, 2009
96.754
-3.041
-3.05%
jan 1, 2010
96.459
-0.296
-0.31%
jan 1, 2011
95.765
-0.693
-0.72%
jan 1, 2012
95.292
-0.474
-0.49%
jan 1, 2013
95.537
+0.246
0.26%
jan 1, 2014
97.032
+1.495
1.56%
jan 1, 2015
97.172
+0.139
0.14%
Ranking of countries by current statistics by years


Comments: