29
/
en
AIzaSyAYiBZKx7MnpbEhh9jyipgxe19OcubqV5w
April 1, 2024
255729
Swaziland
SWZ
true
2
1
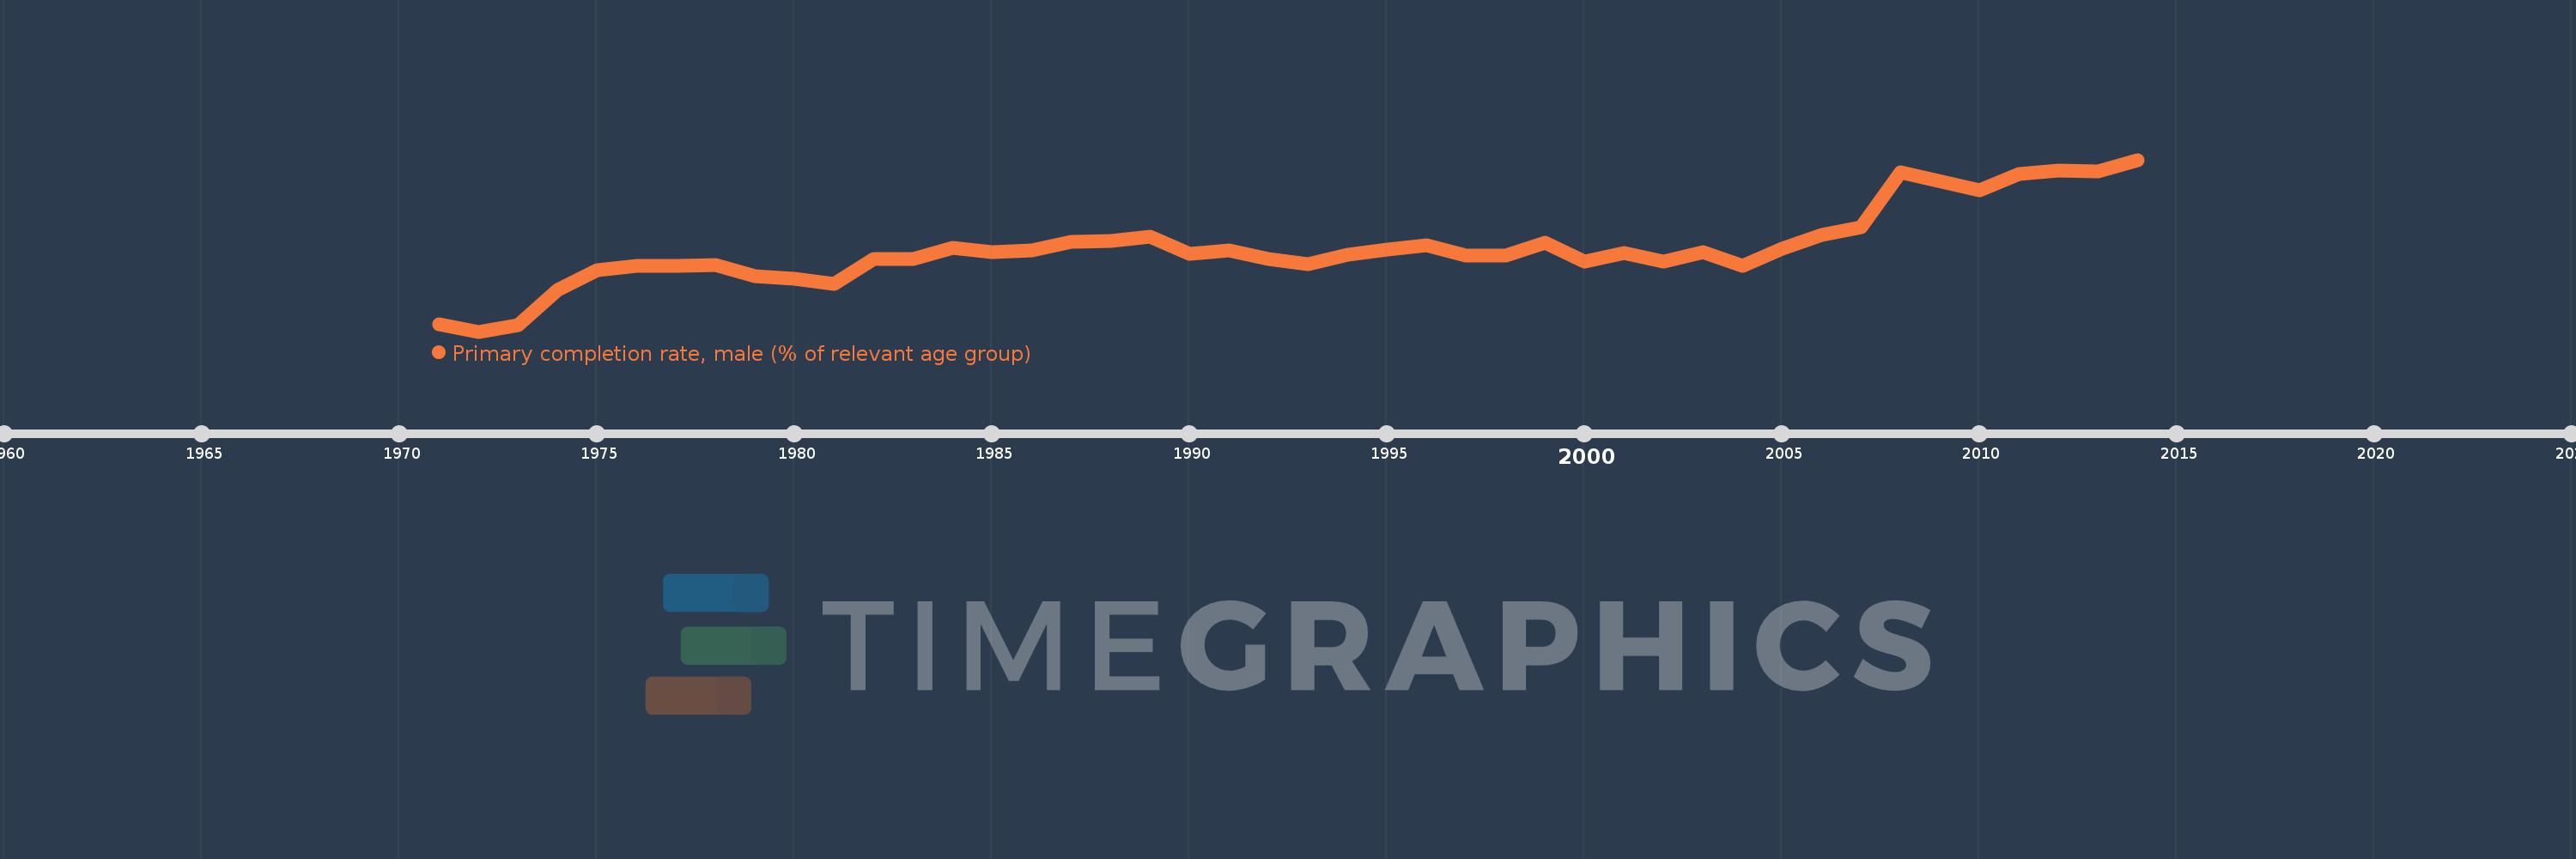
Primary completion rate, male (% of relevant age group)
2014,2013,2012,2011,2010,2008,2007,2006,2005,2004,2003,2002,2001,2000,1999,1998,1997,1996,1995,1994,1993,1992,1991,1990,1989,1988,1987,1986,1985,1984,1983,1982,1981,1980,1979,1978,1977,1976,1975,1974,1973,1972,1971
This statistics in other country:
AfghanistanAlbaniaAlgeriaAngolaAntigua and BarbudaArab WorldArgentinaArmeniaArubaAustriaAzerbaijanBahamas, TheBahrainBangladeshBarbadosBelarusBelgiumBelizeBeninBermudaBhutanBoliviaBosnia and HerzegovinaBotswanaBrunei DarussalamBulgariaBurkina FasoBurundiCabo VerdeCambodiaCameroonCanadaCaribbean small statesCentral African RepublicCentral Europe and the BalticsChadChileChinaColombiaComorosCongo, Dem. Rep.Congo, Rep.Costa RicaCote d'IvoireCroatiaCubaCyprusCzech RepublicDenmarkDjiboutiDominicaDominican RepublicEarly-demographic dividendEast Asia & PacificEast Asia & Pacific (excluding high income)East Asia & Pacific (IDA & IBRD countries)EcuadorEgypt, Arab Rep.El SalvadorEquatorial GuineaEritreaEstoniaEthiopiaEuro areaEurope & Central AsiaEurope & Central Asia (excluding high income)Europe & Central Asia (IDA & IBRD countries)European UnionFijiFinlandFragile and conflict affected situationsFranceGabonGambia, TheGeorgiaGermanyGhanaGreeceGrenadaGuatemalaGuineaGuinea-BissauGuyanaHaitiHeavily indebted poor countries (HIPC)High incomeHondurasHong Kong SAR, ChinaHungaryIBRD onlyIcelandIDA & IBRD totalIDA blendIDA onlyIDA totalIndiaIndonesiaIran, Islamic Rep.IraqIrelandIsraelItalyJamaicaJapanJordanKazakhstanKenyaKiribatiKorea, Dem. People’s Rep.Korea, Rep.KuwaitKyrgyz RepublicLao PDRLate-demographic dividendLatin America & Caribbean Latin America & Caribbean (excluding high income)Latin America & the Caribbean (IDA & IBRD countries)LatviaLeast developed countries: UN classificationLebanonLesothoLiberiaLibyaLiechtensteinLithuaniaLow & middle incomeLow incomeLower middle incomeLuxembourgMacao SAR, ChinaMacedonia, FYRMadagascarMalawiMaldivesMaliMaltaMarshall IslandsMauritaniaMauritiusMexicoMiddle East & North AfricaMiddle East & North Africa (excluding high income)Middle East & North Africa (IDA & IBRD countries)Middle incomeMoldovaMongoliaMontenegroMoroccoMozambiqueMyanmarNamibiaNauruNepalNetherlandsNew ZealandNicaraguaNigerNigeriaNorwayOECD membersOmanOther small statesPacific island small statesPakistanPalauPanamaPapua New GuineaParaguayPeruPhilippinesPolandPortugalPost-demographic dividendPre-demographic dividendQatarRomaniaRussian FederationRwandaSamoaSan MarinoSao Tome and PrincipeSaudi ArabiaSenegalSerbiaSeychellesSierra LeoneSlovak RepublicSloveniaSmall statesSolomon IslandsSouth AfricaSouth AsiaSouth Asia (IDA & IBRD)South SudanSpainSri LankaSt. Kitts and NevisSt. LuciaSt. Vincent and the GrenadinesSub-Saharan Africa Sub-Saharan Africa (excluding high income)Sub-Saharan Africa (IDA & IBRD countries)SudanSurinameSwazilandSwedenSwitzerlandSyrian Arab RepublicTajikistanTanzaniaThailandTimor-LesteTogoTongaTrinidad and TobagoTunisiaTurkeyTuvaluUgandaUkraineUnited Arab EmiratesUpper middle incomeUruguayUzbekistanVanuatuVenezuela, RBVietnamWest Bank and GazaWorldYemen, Rep.ZambiaZimbabwe Timeline:
This timeline shows a graph from 1971 to 2014 of Swaziland. No data until 1970. Number of actual observations by date: 43.
Source name:
World Development Indicators
Source organization:
United Nations Educational, Scientific, and Cultural Organization (UNESCO) Institute for Statistics.
Categories, topics:
Education, Gender
Last updated:
apr 23, 2017
Indicators value changes by year
Maximum:
78.369
jan 1, 2014
At the date of observation
Value
Absolute change
Change from previous value
jan 1, 1971
44.281
+44.281
0.0%
jan 1, 1972
42.7
-1.581
-3.57%
jan 1, 1973
44.06
+1.36
3.19%
jan 1, 1974
51.309
+7.249
16.45%
jan 1, 1975
55.432
+4.123
8.04%
jan 1, 1976
56.26
+0.828
1.49%
jan 1, 1977
56.311
+0.051
0.09%
jan 1, 1978
56.59
+0.278
0.49%
jan 1, 1979
54.249
-2.34
-4.14%
jan 1, 1980
53.739
-0.511
-0.94%
jan 1, 1981
52.523
-1.215
-2.26%
jan 1, 1982
57.78
+5.257
10.01%
jan 1, 1983
57.85
+0.07
0.12%
jan 1, 1984
60.077
+2.227
3.85%
jan 1, 1985
59.263
-0.814
-1.35%
jan 1, 1986
59.618
+0.355
0.6%
jan 1, 1987
61.362
+1.745
2.93%
jan 1, 1988
61.593
+0.23
0.37%
jan 1, 1989
62.471
+0.879
1.43%
jan 1, 1990
58.898
-3.573
-5.72%
jan 1, 1991
59.526
+0.627
1.06%
jan 1, 1992
57.79
-1.735
-2.91%
jan 1, 1993
56.625
-1.166
-2.02%
jan 1, 1994
58.632
+2.007
3.54%
jan 1, 1995
59.658
+1.026
1.75%
jan 1, 1996
60.638
+0.981
1.64%
jan 1, 1997
58.537
-2.101
-3.47%
jan 1, 1998
58.495
-0.042
-0.07%
jan 1, 1999
61.104
+2.609
4.46%
jan 1, 2000
57.21
-3.893
-6.37%
jan 1, 2001
59.093
+1.882
3.29%
jan 1, 2002
57.266
-1.826
-3.09%
jan 1, 2003
59.216
+1.949
3.4%
jan 1, 2004
56.424
-2.792
-4.72%
jan 1, 2005
59.881
+3.458
6.13%
jan 1, 2006
62.715
+2.834
4.73%
jan 1, 2007
64.437
+1.722
2.75%
jan 1, 2008
75.782
+11.346
17.61%
jan 1, 2010
72.089
-3.693
-4.87%
jan 1, 2011
75.43
+3.34
4.63%
jan 1, 2012
76.119
+0.689
0.91%
jan 1, 2013
75.954
-0.165
-0.22%
jan 1, 2014
78.369
+2.415
3.18%
Ranking of countries by current statistics by years


Comments: