29
/
en
AIzaSyAYiBZKx7MnpbEhh9jyipgxe19OcubqV5w
April 1, 2024
148515
Guyana
GUY
true
2
1
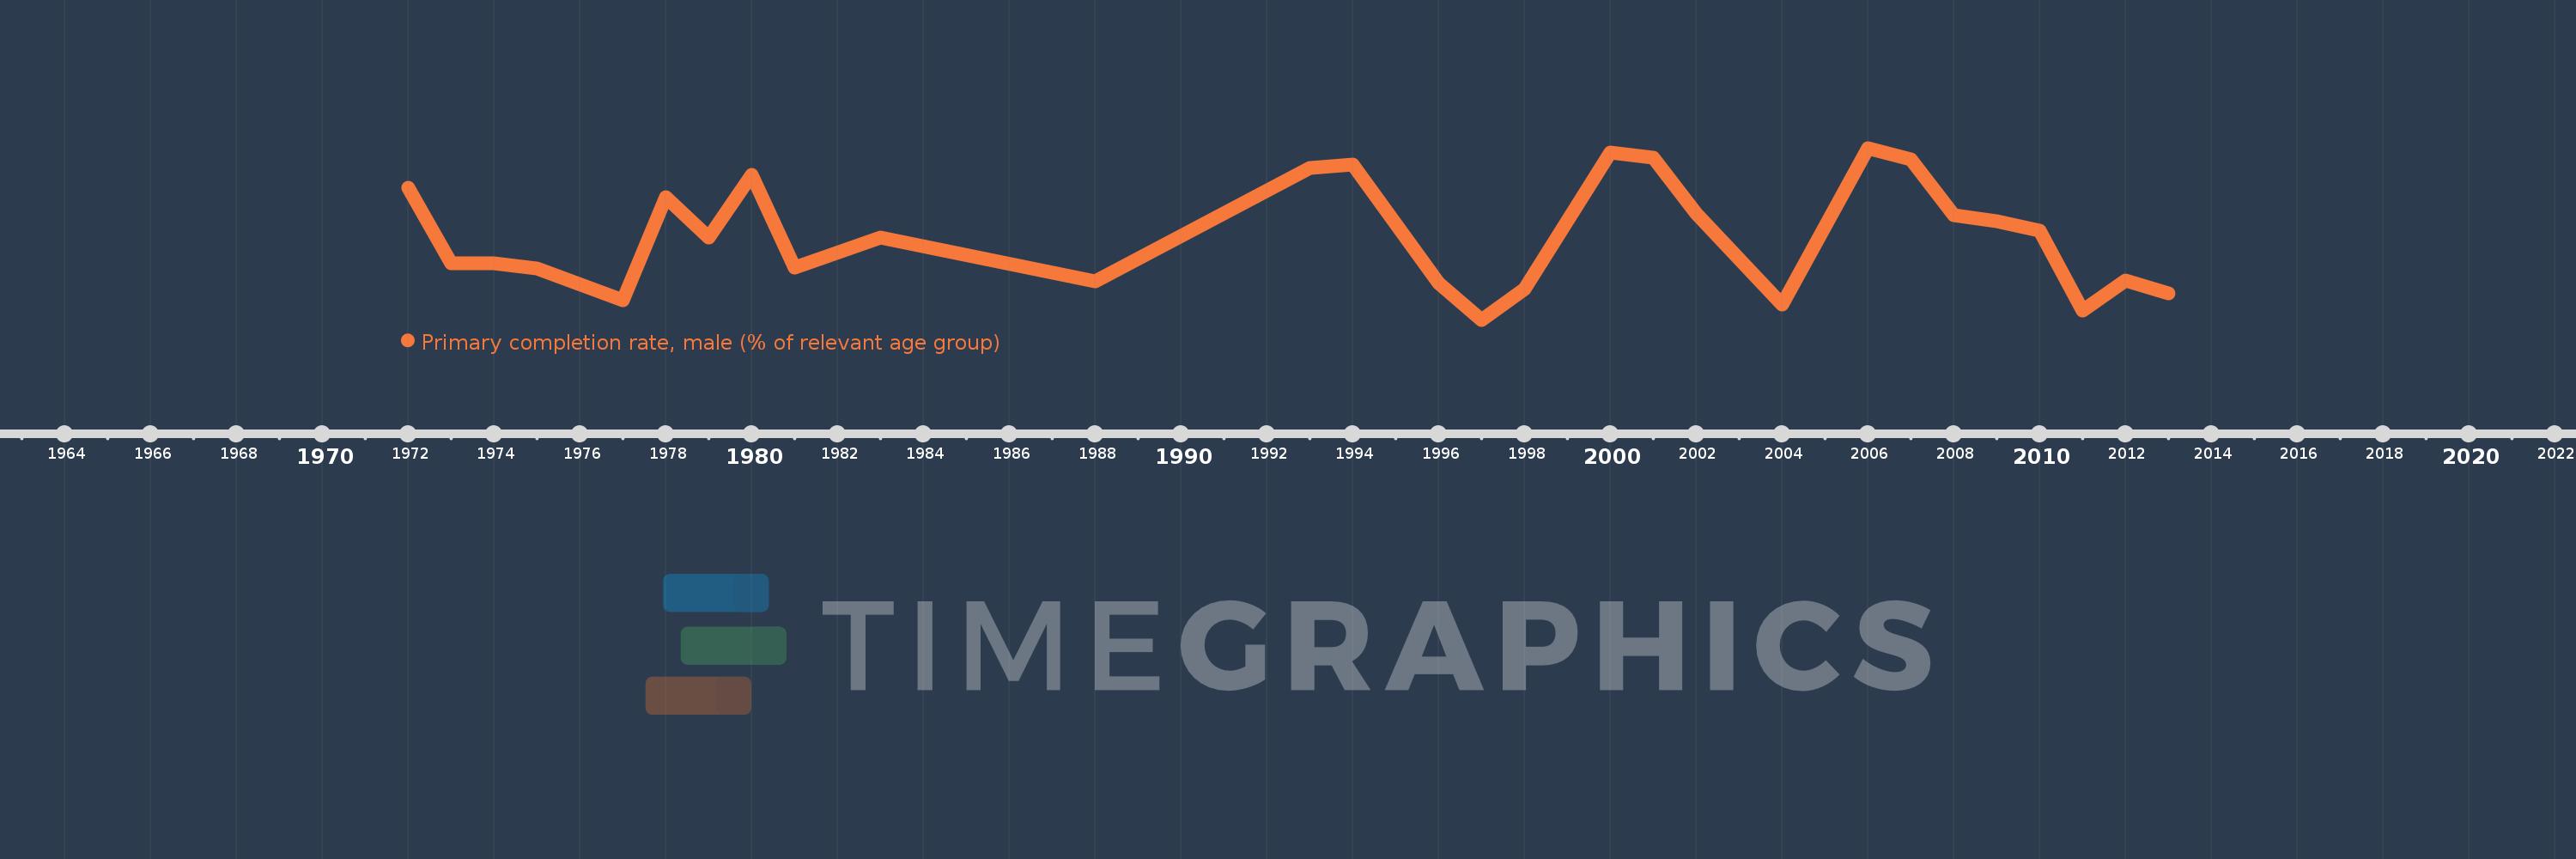
Primary completion rate, male (% of relevant age group)
2013,2012,2011,2010,2009,2008,2007,2006,2004,2002,2001,2000,1998,1997,1996,1994,1993,1988,1983,1981,1980,1979,1978,1977,1975,1974,1973,1972
This statistics in other country:
AfghanistanAlbaniaAlgeriaAngolaAntigua and BarbudaArab WorldArgentinaArmeniaArubaAustriaAzerbaijanBahamas, TheBahrainBangladeshBarbadosBelarusBelgiumBelizeBeninBermudaBhutanBoliviaBosnia and HerzegovinaBotswanaBrunei DarussalamBulgariaBurkina FasoBurundiCabo VerdeCambodiaCameroonCanadaCaribbean small statesCentral African RepublicCentral Europe and the BalticsChadChileChinaColombiaComorosCongo, Dem. Rep.Congo, Rep.Costa RicaCote d'IvoireCroatiaCubaCyprusCzech RepublicDenmarkDjiboutiDominicaDominican RepublicEarly-demographic dividendEast Asia & PacificEast Asia & Pacific (excluding high income)East Asia & Pacific (IDA & IBRD countries)EcuadorEgypt, Arab Rep.El SalvadorEquatorial GuineaEritreaEstoniaEthiopiaEuro areaEurope & Central AsiaEurope & Central Asia (excluding high income)Europe & Central Asia (IDA & IBRD countries)European UnionFijiFinlandFragile and conflict affected situationsFranceGabonGambia, TheGeorgiaGermanyGhanaGreeceGrenadaGuatemalaGuineaGuinea-BissauGuyanaHaitiHeavily indebted poor countries (HIPC)High incomeHondurasHong Kong SAR, ChinaHungaryIBRD onlyIcelandIDA & IBRD totalIDA blendIDA onlyIDA totalIndiaIndonesiaIran, Islamic Rep.IraqIrelandIsraelItalyJamaicaJapanJordanKazakhstanKenyaKiribatiKorea, Dem. People’s Rep.Korea, Rep.KuwaitKyrgyz RepublicLao PDRLate-demographic dividendLatin America & Caribbean Latin America & Caribbean (excluding high income)Latin America & the Caribbean (IDA & IBRD countries)LatviaLeast developed countries: UN classificationLebanonLesothoLiberiaLibyaLiechtensteinLithuaniaLow & middle incomeLow incomeLower middle incomeLuxembourgMacao SAR, ChinaMacedonia, FYRMadagascarMalawiMaldivesMaliMaltaMarshall IslandsMauritaniaMauritiusMexicoMiddle East & North AfricaMiddle East & North Africa (excluding high income)Middle East & North Africa (IDA & IBRD countries)Middle incomeMoldovaMongoliaMontenegroMoroccoMozambiqueMyanmarNamibiaNauruNepalNetherlandsNew ZealandNicaraguaNigerNigeriaNorwayOECD membersOmanOther small statesPacific island small statesPakistanPalauPanamaPapua New GuineaParaguayPeruPhilippinesPolandPortugalPost-demographic dividendPre-demographic dividendQatarRomaniaRussian FederationRwandaSamoaSan MarinoSao Tome and PrincipeSaudi ArabiaSenegalSerbiaSeychellesSierra LeoneSlovak RepublicSloveniaSmall statesSolomon IslandsSouth AfricaSouth AsiaSouth Asia (IDA & IBRD)South SudanSpainSri LankaSt. Kitts and NevisSt. LuciaSt. Vincent and the GrenadinesSub-Saharan Africa Sub-Saharan Africa (excluding high income)Sub-Saharan Africa (IDA & IBRD countries)SudanSurinameSwazilandSwedenSwitzerlandSyrian Arab RepublicTajikistanTanzaniaThailandTimor-LesteTogoTongaTrinidad and TobagoTunisiaTurkeyTuvaluUgandaUkraineUnited Arab EmiratesUpper middle incomeUruguayUzbekistanVanuatuVenezuela, RBVietnamWest Bank and GazaWorldYemen, Rep.ZambiaZimbabwe Timeline:
This timeline shows a graph from 1972 to 2013 of Guyana. No data until 1971. Number of actual observations by date: 28.
Source name:
World Development Indicators
Source organization:
United Nations Educational, Scientific, and Cultural Organization (UNESCO) Institute for Statistics.
Categories, topics:
Education, Gender
Last updated:
apr 23, 2017
Indicators value changes by year
Minimum:
84.107
jan 1, 1997
Maximum:
100.92
jan 1, 2006
At the date of observation
Value
Absolute change
Change from previous value
jan 1, 1972
97.0
+97.0
0.0%
jan 1, 1973
89.598
-7.401
-7.63%
jan 1, 1974
89.598
+0.0
0.0%
jan 1, 1975
89.086
-0.513
-0.57%
jan 1, 1977
85.989
-3.097
-3.48%
jan 1, 1978
96.115
+10.126
11.78%
jan 1, 1979
92.146
-3.969
-4.13%
jan 1, 1980
98.324
+6.179
6.71%
jan 1, 1981
89.193
-9.131
-9.29%
jan 1, 1983
92.174
+2.98
3.34%
jan 1, 1988
87.86
-4.313
-4.68%
jan 1, 1993
98.929
+11.069
12.6%
jan 1, 1994
99.332
+0.403
0.41%
jan 1, 1996
87.722
-11.61
-11.69%
jan 1, 1997
84.107
-3.615
-4.12%
jan 1, 1998
87.134
+3.027
3.6%
jan 1, 2000
100.468
+13.334
15.3%
jan 1, 2001
99.951
-0.517
-0.51%
jan 1, 2002
94.472
-5.478
-5.48%
jan 1, 2004
85.582
-8.89
-9.41%
jan 1, 2006
100.92
+15.338
17.92%
jan 1, 2007
99.786
-1.135
-1.12%
jan 1, 2008
94.33
-5.455
-5.47%
jan 1, 2009
93.716
-0.614
-0.65%
jan 1, 2010
92.803
-0.913
-0.97%
jan 1, 2011
84.984
-7.82
-8.43%
jan 1, 2012
87.987
+3.003
3.53%
jan 1, 2013
86.661
-1.326
-1.51%
Ranking of countries by current statistics by years


Comments: