29
/
en
AIzaSyAYiBZKx7MnpbEhh9jyipgxe19OcubqV5w
April 1, 2024
40278
IDA total
IDA
false
2
1
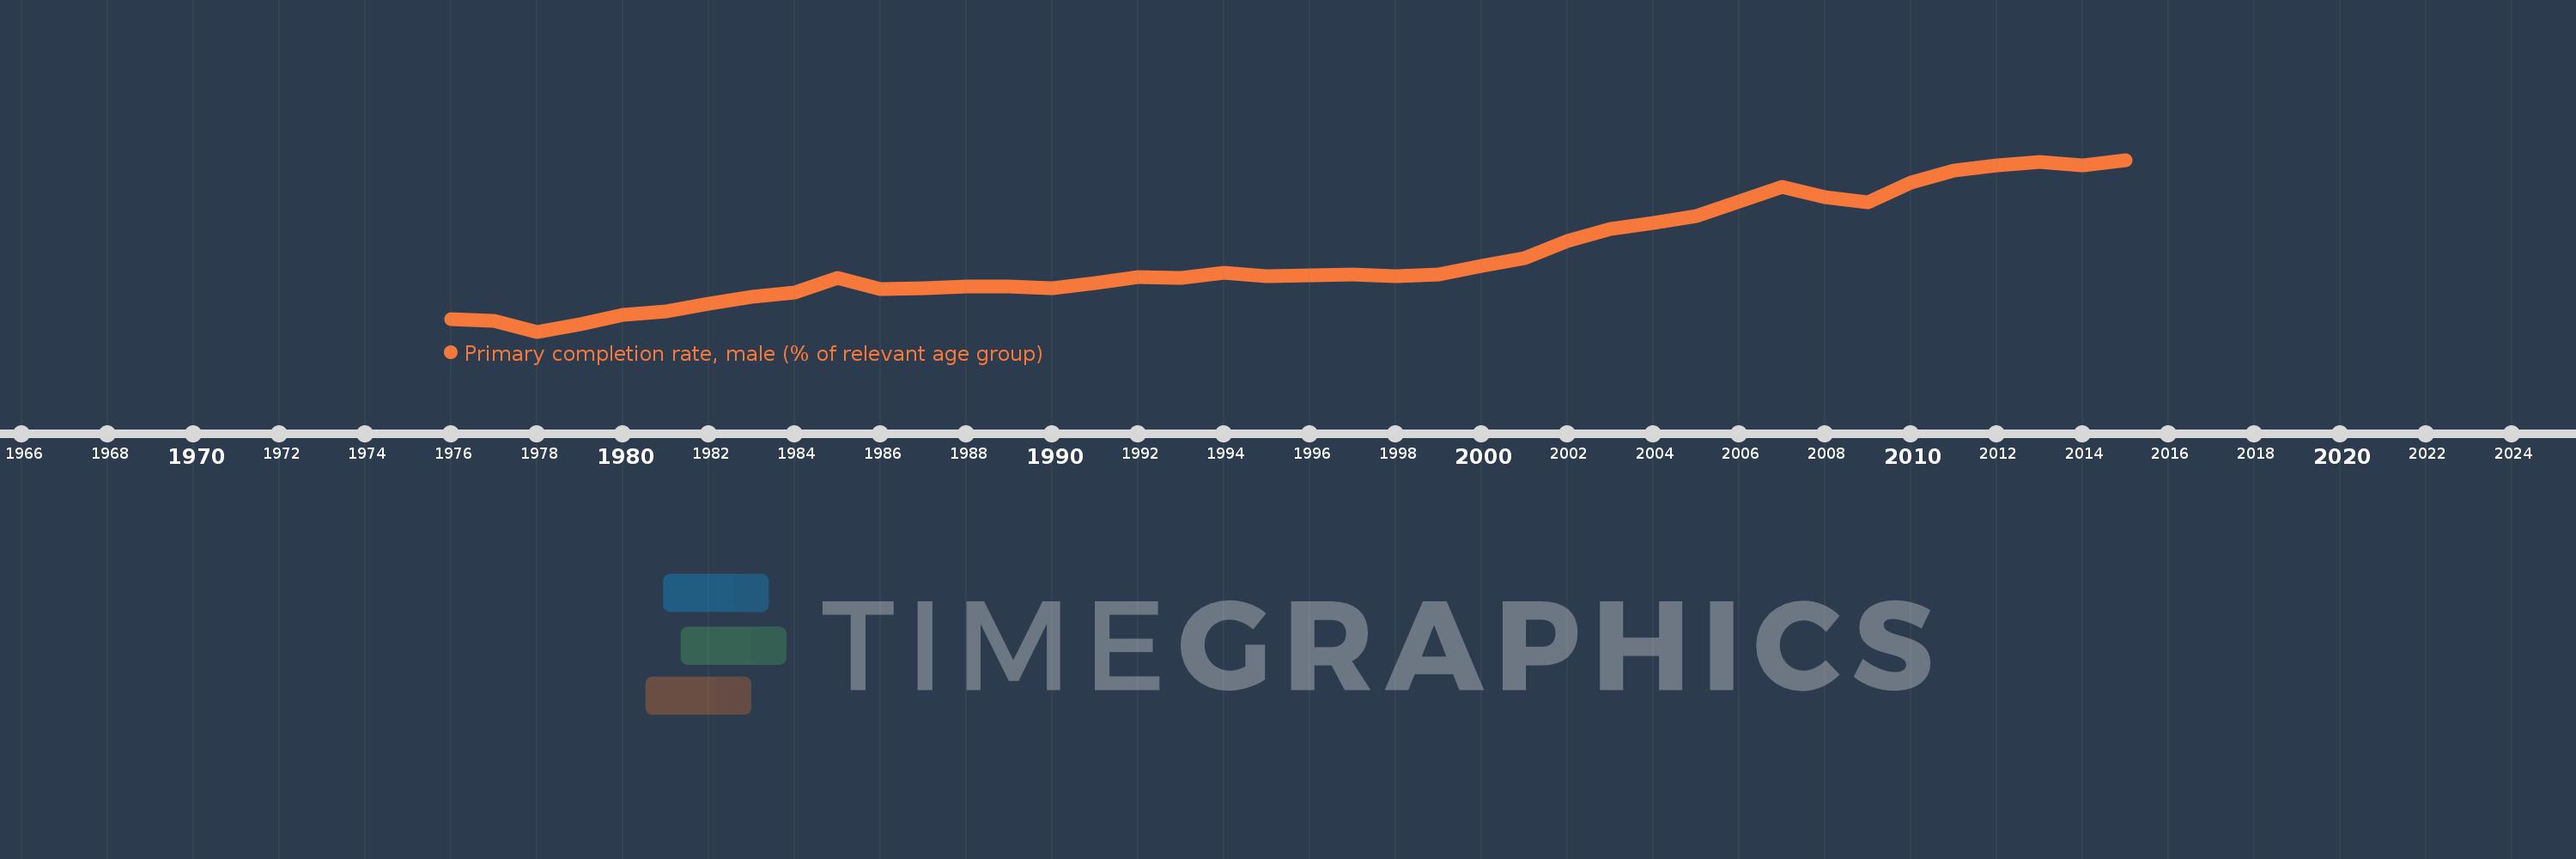
Primary completion rate, male (% of relevant age group)
2015,2014,2013,2012,2011,2010,2009,2008,2007,2006,2005,2004,2003,2002,2001,2000,1999,1998,1997,1996,1995,1994,1993,1992,1991,1990,1989,1988,1987,1986,1985,1984,1983,1982,1981,1980,1979,1978,1977,1976
This statistics in other country:
AfghanistanAlbaniaAlgeriaAngolaAntigua and BarbudaArab WorldArgentinaArmeniaArubaAustriaAzerbaijanBahamas, TheBahrainBangladeshBarbadosBelarusBelgiumBelizeBeninBermudaBhutanBoliviaBosnia and HerzegovinaBotswanaBrunei DarussalamBulgariaBurkina FasoBurundiCabo VerdeCambodiaCameroonCanadaCaribbean small statesCentral African RepublicCentral Europe and the BalticsChadChileChinaColombiaComorosCongo, Dem. Rep.Congo, Rep.Costa RicaCote d'IvoireCroatiaCubaCyprusCzech RepublicDenmarkDjiboutiDominicaDominican RepublicEarly-demographic dividendEast Asia & PacificEast Asia & Pacific (excluding high income)East Asia & Pacific (IDA & IBRD countries)EcuadorEgypt, Arab Rep.El SalvadorEquatorial GuineaEritreaEstoniaEthiopiaEuro areaEurope & Central AsiaEurope & Central Asia (excluding high income)Europe & Central Asia (IDA & IBRD countries)European UnionFijiFinlandFragile and conflict affected situationsFranceGabonGambia, TheGeorgiaGermanyGhanaGreeceGrenadaGuatemalaGuineaGuinea-BissauGuyanaHaitiHeavily indebted poor countries (HIPC)High incomeHondurasHong Kong SAR, ChinaHungaryIBRD onlyIcelandIDA & IBRD totalIDA blendIDA onlyIDA totalIndiaIndonesiaIran, Islamic Rep.IraqIrelandIsraelItalyJamaicaJapanJordanKazakhstanKenyaKiribatiKorea, Dem. People’s Rep.Korea, Rep.KuwaitKyrgyz RepublicLao PDRLate-demographic dividendLatin America & Caribbean Latin America & Caribbean (excluding high income)Latin America & the Caribbean (IDA & IBRD countries)LatviaLeast developed countries: UN classificationLebanonLesothoLiberiaLibyaLiechtensteinLithuaniaLow & middle incomeLow incomeLower middle incomeLuxembourgMacao SAR, ChinaMacedonia, FYRMadagascarMalawiMaldivesMaliMaltaMarshall IslandsMauritaniaMauritiusMexicoMiddle East & North AfricaMiddle East & North Africa (excluding high income)Middle East & North Africa (IDA & IBRD countries)Middle incomeMoldovaMongoliaMontenegroMoroccoMozambiqueMyanmarNamibiaNauruNepalNetherlandsNew ZealandNicaraguaNigerNigeriaNorwayOECD membersOmanOther small statesPacific island small statesPakistanPalauPanamaPapua New GuineaParaguayPeruPhilippinesPolandPortugalPost-demographic dividendPre-demographic dividendQatarRomaniaRussian FederationRwandaSamoaSan MarinoSao Tome and PrincipeSaudi ArabiaSenegalSerbiaSeychellesSierra LeoneSlovak RepublicSloveniaSmall statesSolomon IslandsSouth AfricaSouth AsiaSouth Asia (IDA & IBRD)South SudanSpainSri LankaSt. Kitts and NevisSt. LuciaSt. Vincent and the GrenadinesSub-Saharan Africa Sub-Saharan Africa (excluding high income)Sub-Saharan Africa (IDA & IBRD countries)SudanSurinameSwazilandSwedenSwitzerlandSyrian Arab RepublicTajikistanTanzaniaThailandTimor-LesteTogoTongaTrinidad and TobagoTunisiaTurkeyTuvaluUgandaUkraineUnited Arab EmiratesUpper middle incomeUruguayUzbekistanVanuatuVenezuela, RBVietnamWest Bank and GazaWorldYemen, Rep.ZambiaZimbabwe Timeline:
This timeline shows a graph from 1976 to 2015 of IDA total. No data until 1975. Number of actual observations by date: 40.
Source name:
World Development Indicators
Source organization:
United Nations Educational, Scientific, and Cultural Organization (UNESCO) Institute for Statistics.
Categories, topics:
Education, Gender
Last updated:
apr 23, 2017
Indicators value changes by year
At the date of observation
Value
Absolute change
Change from previous value
jan 1, 1976
60.94
+60.94
0.0%
jan 1, 1977
60.729
-0.211
-0.35%
jan 1, 1978
59.72
-1.009
-1.66%
jan 1, 1979
60.448
+0.728
1.22%
jan 1, 1980
61.286
+0.837
1.39%
jan 1, 1981
61.661
+0.376
0.61%
jan 1, 1982
62.378
+0.716
1.16%
jan 1, 1983
63.005
+0.627
1.01%
jan 1, 1984
63.459
+0.454
0.72%
jan 1, 1985
64.823
+1.364
2.15%
jan 1, 1986
63.723
-1.1
-1.7%
jan 1, 1987
63.874
+0.151
0.24%
jan 1, 1988
63.994
+0.12
0.19%
jan 1, 1989
63.993
0.0
0.0%
jan 1, 1990
63.812
-0.181
-0.28%
jan 1, 1991
64.35
+0.539
0.84%
jan 1, 1992
64.898
+0.548
0.85%
jan 1, 1993
64.797
-0.101
-0.16%
jan 1, 1994
65.35
+0.554
0.85%
jan 1, 1995
65.011
-0.34
-0.52%
jan 1, 1996
65.085
+0.074
0.11%
jan 1, 1997
65.121
+0.036
0.06%
jan 1, 1998
65.011
-0.11
-0.17%
jan 1, 1999
65.18
+0.169
0.26%
jan 1, 2000
66.002
+0.822
1.26%
jan 1, 2001
66.708
+0.706
1.07%
jan 1, 2002
68.35
+1.642
2.46%
jan 1, 2003
69.489
+1.139
1.67%
jan 1, 2004
70.021
+0.532
0.77%
jan 1, 2005
70.656
+0.635
0.91%
jan 1, 2006
72.044
+1.387
1.96%
jan 1, 2007
73.474
+1.43
1.99%
jan 1, 2008
72.489
-0.985
-1.34%
jan 1, 2009
71.987
-0.502
-0.69%
jan 1, 2010
73.856
+1.869
2.6%
jan 1, 2011
75.029
+1.173
1.59%
jan 1, 2012
75.543
+0.514
0.69%
jan 1, 2013
75.815
+0.272
0.36%
jan 1, 2014
75.538
-0.277
-0.37%
jan 1, 2015
76.04
+0.503
0.67%
Ranking of countries by current statistics by years


Comments: