29
/
en
AIzaSyAYiBZKx7MnpbEhh9jyipgxe19OcubqV5w
April 1, 2024
36933
IBRD only
IBD
false
2
1
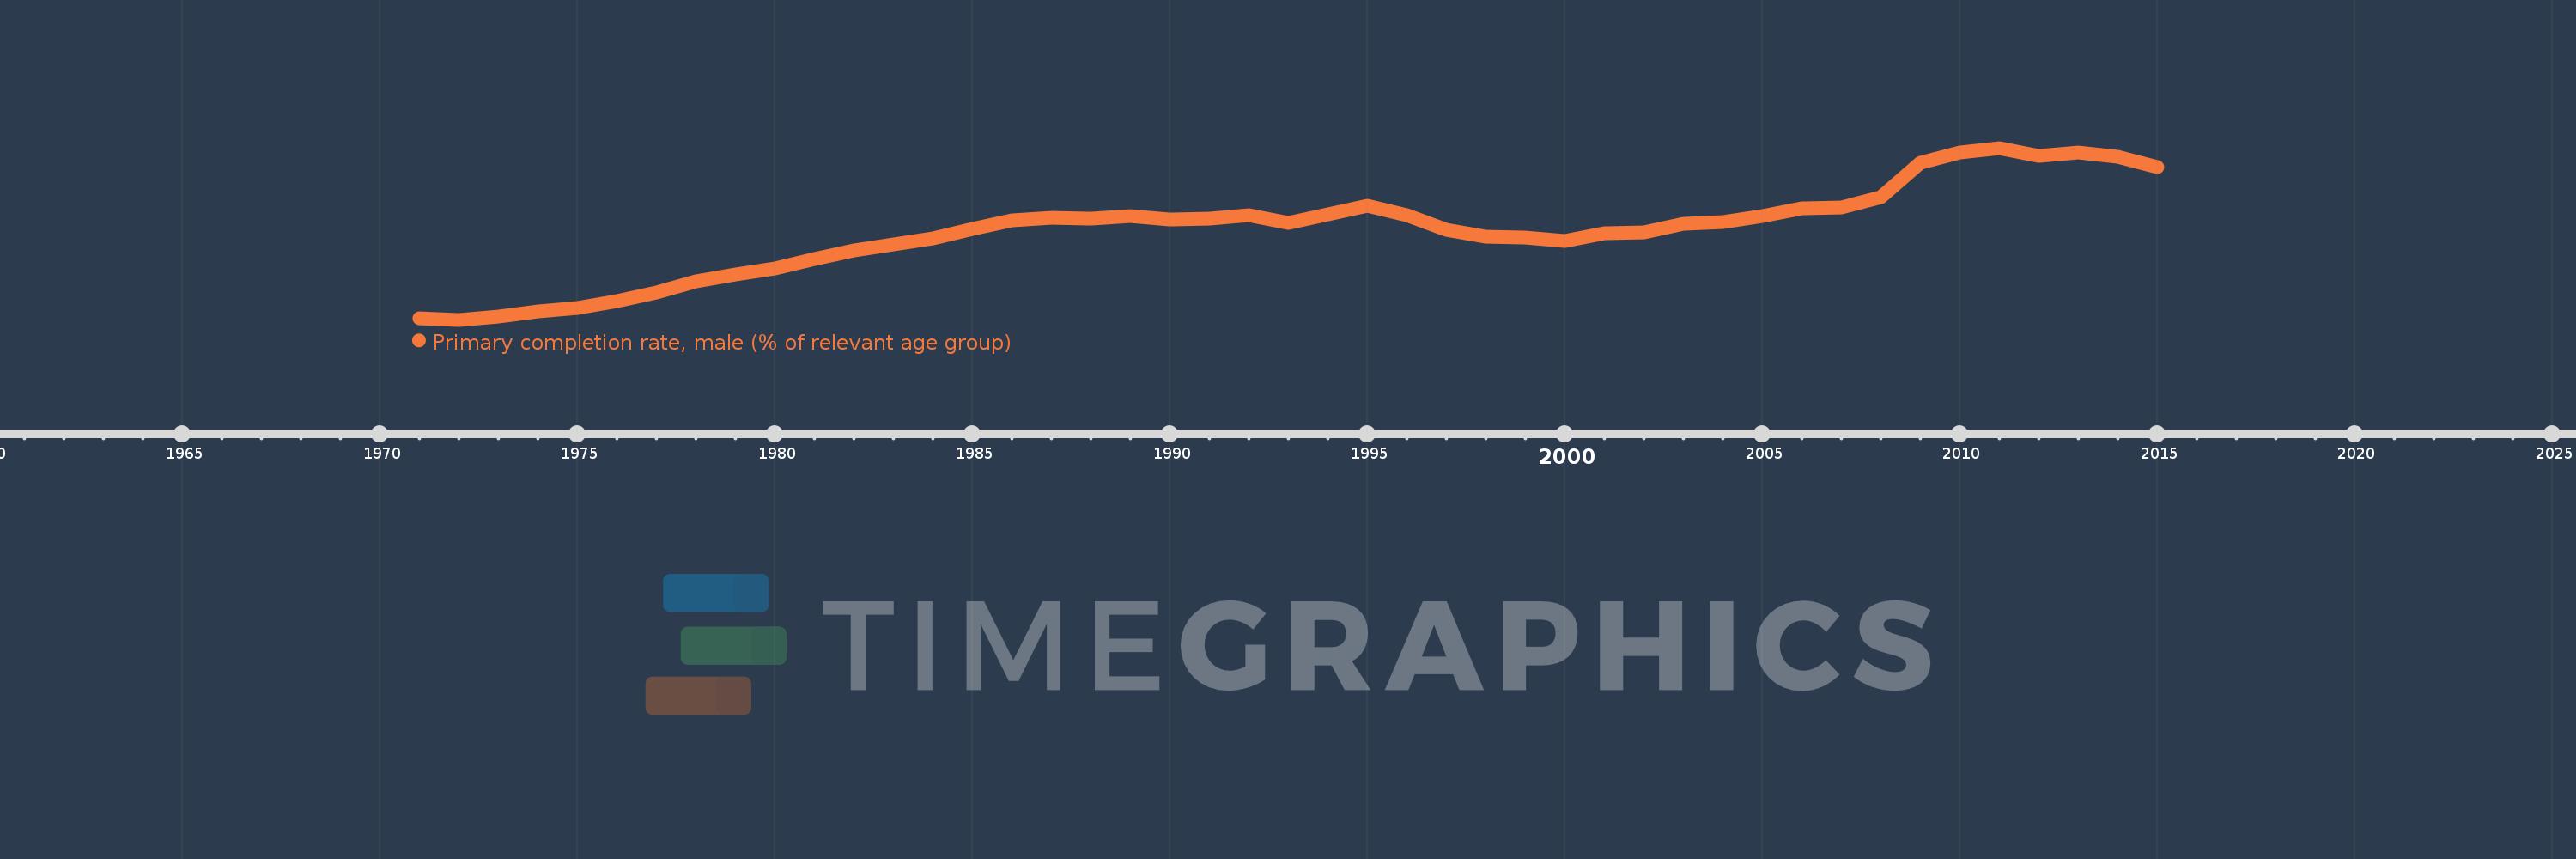
Primary completion rate, male (% of relevant age group)
2015,2014,2013,2012,2011,2010,2009,2008,2007,2006,2005,2004,2003,2002,2001,2000,1999,1998,1997,1996,1995,1994,1993,1992,1991,1990,1989,1988,1987,1986,1985,1984,1983,1982,1981,1980,1979,1978,1977,1976,1975,1974,1973,1972,1971
This statistics in other country:
AfghanistanAlbaniaAlgeriaAngolaAntigua and BarbudaArab WorldArgentinaArmeniaArubaAustriaAzerbaijanBahamas, TheBahrainBangladeshBarbadosBelarusBelgiumBelizeBeninBermudaBhutanBoliviaBosnia and HerzegovinaBotswanaBrunei DarussalamBulgariaBurkina FasoBurundiCabo VerdeCambodiaCameroonCanadaCaribbean small statesCentral African RepublicCentral Europe and the BalticsChadChileChinaColombiaComorosCongo, Dem. Rep.Congo, Rep.Costa RicaCote d'IvoireCroatiaCubaCyprusCzech RepublicDenmarkDjiboutiDominicaDominican RepublicEarly-demographic dividendEast Asia & PacificEast Asia & Pacific (excluding high income)East Asia & Pacific (IDA & IBRD countries)EcuadorEgypt, Arab Rep.El SalvadorEquatorial GuineaEritreaEstoniaEthiopiaEuro areaEurope & Central AsiaEurope & Central Asia (excluding high income)Europe & Central Asia (IDA & IBRD countries)European UnionFijiFinlandFragile and conflict affected situationsFranceGabonGambia, TheGeorgiaGermanyGhanaGreeceGrenadaGuatemalaGuineaGuinea-BissauGuyanaHaitiHeavily indebted poor countries (HIPC)High incomeHondurasHong Kong SAR, ChinaHungaryIBRD onlyIcelandIDA & IBRD totalIDA blendIDA onlyIDA totalIndiaIndonesiaIran, Islamic Rep.IraqIrelandIsraelItalyJamaicaJapanJordanKazakhstanKenyaKiribatiKorea, Dem. People’s Rep.Korea, Rep.KuwaitKyrgyz RepublicLao PDRLate-demographic dividendLatin America & Caribbean Latin America & Caribbean (excluding high income)Latin America & the Caribbean (IDA & IBRD countries)LatviaLeast developed countries: UN classificationLebanonLesothoLiberiaLibyaLiechtensteinLithuaniaLow & middle incomeLow incomeLower middle incomeLuxembourgMacao SAR, ChinaMacedonia, FYRMadagascarMalawiMaldivesMaliMaltaMarshall IslandsMauritaniaMauritiusMexicoMiddle East & North AfricaMiddle East & North Africa (excluding high income)Middle East & North Africa (IDA & IBRD countries)Middle incomeMoldovaMongoliaMontenegroMoroccoMozambiqueMyanmarNamibiaNauruNepalNetherlandsNew ZealandNicaraguaNigerNigeriaNorwayOECD membersOmanOther small statesPacific island small statesPakistanPalauPanamaPapua New GuineaParaguayPeruPhilippinesPolandPortugalPost-demographic dividendPre-demographic dividendQatarRomaniaRussian FederationRwandaSamoaSan MarinoSao Tome and PrincipeSaudi ArabiaSenegalSerbiaSeychellesSierra LeoneSlovak RepublicSloveniaSmall statesSolomon IslandsSouth AfricaSouth AsiaSouth Asia (IDA & IBRD)South SudanSpainSri LankaSt. Kitts and NevisSt. LuciaSt. Vincent and the GrenadinesSub-Saharan Africa Sub-Saharan Africa (excluding high income)Sub-Saharan Africa (IDA & IBRD countries)SudanSurinameSwazilandSwedenSwitzerlandSyrian Arab RepublicTajikistanTanzaniaThailandTimor-LesteTogoTongaTrinidad and TobagoTunisiaTurkeyTuvaluUgandaUkraineUnited Arab EmiratesUpper middle incomeUruguayUzbekistanVanuatuVenezuela, RBVietnamWest Bank and GazaWorldYemen, Rep.ZambiaZimbabwe Timeline:
This timeline shows a graph from 1971 to 2015 of IBRD only. No data until 1970. Number of actual observations by date: 45.
Source name:
World Development Indicators
Source organization:
United Nations Educational, Scientific, and Cultural Organization (UNESCO) Institute for Statistics.
Categories, topics:
Education, Gender
Last updated:
apr 23, 2017
Indicators value changes by year
Minimum:
79.521
jan 1, 1972
At the date of observation
Value
Absolute change
Change from previous value
jan 1, 1971
79.727
+79.727
0.0%
jan 1, 1972
79.521
-0.206
-0.26%
jan 1, 1973
79.877
+0.356
0.45%
jan 1, 1974
80.501
+0.624
0.78%
jan 1, 1975
80.837
+0.335
0.42%
jan 1, 1976
81.656
+0.819
1.01%
jan 1, 1977
82.566
+0.91
1.11%
jan 1, 1978
83.832
+1.266
1.53%
jan 1, 1979
84.594
+0.763
0.91%
jan 1, 1980
85.287
+0.693
0.82%
jan 1, 1981
86.367
+1.081
1.27%
jan 1, 1982
87.334
+0.966
1.12%
jan 1, 1983
87.932
+0.598
0.68%
jan 1, 1984
88.615
+0.684
0.78%
jan 1, 1985
89.653
+1.038
1.17%
jan 1, 1986
90.634
+0.981
1.09%
jan 1, 1987
90.949
+0.315
0.35%
jan 1, 1988
90.897
-0.053
-0.06%
jan 1, 1989
91.095
+0.198
0.22%
jan 1, 1990
90.734
-0.361
-0.4%
jan 1, 1991
90.845
+0.112
0.12%
jan 1, 1992
91.205
+0.36
0.4%
jan 1, 1993
90.385
-0.821
-0.9%
jan 1, 1994
91.35
+0.965
1.07%
jan 1, 1995
92.254
+0.904
0.99%
jan 1, 1996
91.26
-0.994
-1.08%
jan 1, 1997
89.592
-1.668
-1.83%
jan 1, 1998
88.841
-0.751
-0.84%
jan 1, 1999
88.735
-0.106
-0.12%
jan 1, 2000
88.377
-0.357
-0.4%
jan 1, 2001
89.243
+0.866
0.98%
jan 1, 2002
89.344
+0.101
0.11%
jan 1, 2003
90.261
+0.917
1.03%
jan 1, 2004
90.485
+0.225
0.25%
jan 1, 2005
91.176
+0.691
0.76%
jan 1, 2006
91.978
+0.802
0.88%
jan 1, 2007
92.12
+0.142
0.15%
jan 1, 2008
93.266
+1.146
1.24%
jan 1, 2009
97.091
+3.825
4.1%
jan 1, 2010
98.29
+1.199
1.23%
jan 1, 2011
98.77
+0.48
0.49%
jan 1, 2012
97.875
-0.894
-0.91%
jan 1, 2013
98.282
+0.406
0.42%
jan 1, 2014
97.757
-0.524
-0.53%
jan 1, 2015
96.583
-1.174
-1.2%
Ranking of countries by current statistics by years


Comments: