29
/
en
AIzaSyAYiBZKx7MnpbEhh9jyipgxe19OcubqV5w
April 1, 2024
42915
Latin America & Caribbean (excluding high income)
LAC
false
2
1
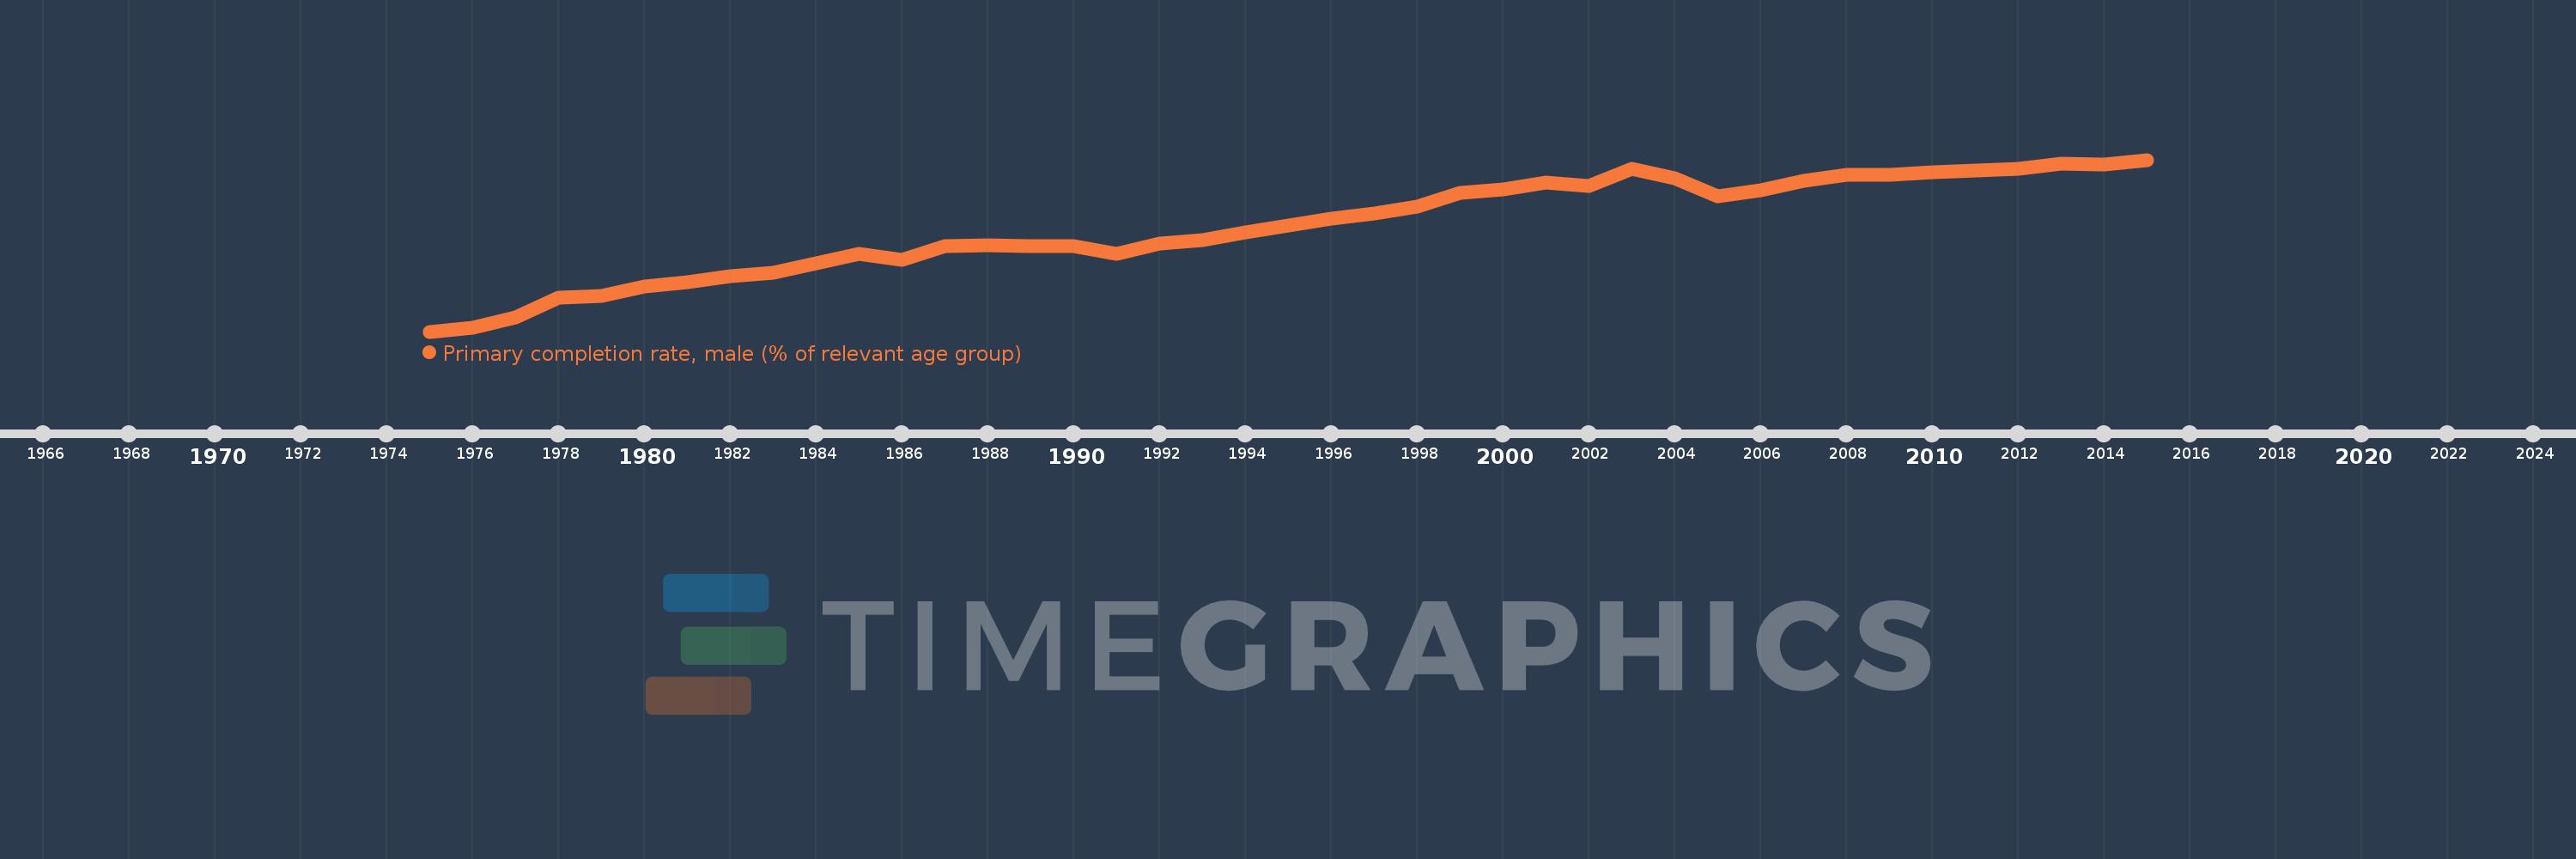
Primary completion rate, male (% of relevant age group)
2015,2014,2013,2012,2011,2010,2009,2008,2007,2006,2005,2004,2003,2002,2001,2000,1999,1998,1997,1996,1995,1994,1993,1992,1991,1990,1989,1988,1987,1986,1985,1984,1983,1982,1981,1980,1979,1978,1977,1976,1975
This statistics in other country:
AfghanistanAlbaniaAlgeriaAngolaAntigua and BarbudaArab WorldArgentinaArmeniaArubaAustriaAzerbaijanBahamas, TheBahrainBangladeshBarbadosBelarusBelgiumBelizeBeninBermudaBhutanBoliviaBosnia and HerzegovinaBotswanaBrunei DarussalamBulgariaBurkina FasoBurundiCabo VerdeCambodiaCameroonCanadaCaribbean small statesCentral African RepublicCentral Europe and the BalticsChadChileChinaColombiaComorosCongo, Dem. Rep.Congo, Rep.Costa RicaCote d'IvoireCroatiaCubaCyprusCzech RepublicDenmarkDjiboutiDominicaDominican RepublicEarly-demographic dividendEast Asia & PacificEast Asia & Pacific (excluding high income)East Asia & Pacific (IDA & IBRD countries)EcuadorEgypt, Arab Rep.El SalvadorEquatorial GuineaEritreaEstoniaEthiopiaEuro areaEurope & Central AsiaEurope & Central Asia (excluding high income)Europe & Central Asia (IDA & IBRD countries)European UnionFijiFinlandFragile and conflict affected situationsFranceGabonGambia, TheGeorgiaGermanyGhanaGreeceGrenadaGuatemalaGuineaGuinea-BissauGuyanaHaitiHeavily indebted poor countries (HIPC)High incomeHondurasHong Kong SAR, ChinaHungaryIBRD onlyIcelandIDA & IBRD totalIDA blendIDA onlyIDA totalIndiaIndonesiaIran, Islamic Rep.IraqIrelandIsraelItalyJamaicaJapanJordanKazakhstanKenyaKiribatiKorea, Dem. People’s Rep.Korea, Rep.KuwaitKyrgyz RepublicLao PDRLate-demographic dividendLatin America & Caribbean Latin America & Caribbean (excluding high income)Latin America & the Caribbean (IDA & IBRD countries)LatviaLeast developed countries: UN classificationLebanonLesothoLiberiaLibyaLiechtensteinLithuaniaLow & middle incomeLow incomeLower middle incomeLuxembourgMacao SAR, ChinaMacedonia, FYRMadagascarMalawiMaldivesMaliMaltaMarshall IslandsMauritaniaMauritiusMexicoMiddle East & North AfricaMiddle East & North Africa (excluding high income)Middle East & North Africa (IDA & IBRD countries)Middle incomeMoldovaMongoliaMontenegroMoroccoMozambiqueMyanmarNamibiaNauruNepalNetherlandsNew ZealandNicaraguaNigerNigeriaNorwayOECD membersOmanOther small statesPacific island small statesPakistanPalauPanamaPapua New GuineaParaguayPeruPhilippinesPolandPortugalPost-demographic dividendPre-demographic dividendQatarRomaniaRussian FederationRwandaSamoaSan MarinoSao Tome and PrincipeSaudi ArabiaSenegalSerbiaSeychellesSierra LeoneSlovak RepublicSloveniaSmall statesSolomon IslandsSouth AfricaSouth AsiaSouth Asia (IDA & IBRD)South SudanSpainSri LankaSt. Kitts and NevisSt. LuciaSt. Vincent and the GrenadinesSub-Saharan Africa Sub-Saharan Africa (excluding high income)Sub-Saharan Africa (IDA & IBRD countries)SudanSurinameSwazilandSwedenSwitzerlandSyrian Arab RepublicTajikistanTanzaniaThailandTimor-LesteTogoTongaTrinidad and TobagoTunisiaTurkeyTuvaluUgandaUkraineUnited Arab EmiratesUpper middle incomeUruguayUzbekistanVanuatuVenezuela, RBVietnamWest Bank and GazaWorldYemen, Rep.ZambiaZimbabwe Timeline:
This timeline shows a graph from 1975 to 2015 of Latin America & Caribbean (excluding high income). No data until 1974. Number of actual observations by date: 41.
Source name:
World Development Indicators
Source organization:
United Nations Educational, Scientific, and Cultural Organization (UNESCO) Institute for Statistics.
Categories, topics:
Education, Gender
Last updated:
apr 23, 2017
Indicators value changes by year
Minimum:
80.759
jan 1, 1975
Maximum:
99.799
jan 1, 2015
At the date of observation
Value
Absolute change
Change from previous value
jan 1, 1975
80.759
+80.759
0.0%
jan 1, 1976
81.151
+0.392
0.48%
jan 1, 1977
82.305
+1.154
1.42%
jan 1, 1978
84.487
+2.182
2.65%
jan 1, 1979
84.713
+0.226
0.27%
jan 1, 1980
85.763
+1.051
1.24%
jan 1, 1981
86.275
+0.512
0.6%
jan 1, 1982
86.858
+0.582
0.67%
jan 1, 1983
87.25
+0.393
0.45%
jan 1, 1984
88.289
+1.039
1.19%
jan 1, 1985
89.336
+1.047
1.19%
jan 1, 1986
88.738
-0.598
-0.67%
jan 1, 1987
90.245
+1.507
1.7%
jan 1, 1988
90.306
+0.061
0.07%
jan 1, 1989
90.257
-0.049
-0.05%
jan 1, 1990
90.222
-0.035
-0.04%
jan 1, 1991
89.368
-0.853
-0.95%
jan 1, 1992
90.501
+1.133
1.27%
jan 1, 1993
90.935
+0.434
0.48%
jan 1, 1994
91.782
+0.847
0.93%
jan 1, 1995
92.5
+0.718
0.78%
jan 1, 1996
93.241
+0.742
0.8%
jan 1, 1997
93.803
+0.562
0.6%
jan 1, 1998
94.6
+0.797
0.85%
jan 1, 1999
96.096
+1.496
1.58%
jan 1, 2000
96.5
+0.405
0.42%
jan 1, 2001
97.323
+0.822
0.85%
jan 1, 2002
96.854
-0.469
-0.48%
jan 1, 2003
98.768
+1.914
1.98%
jan 1, 2004
97.717
-1.051
-1.06%
jan 1, 2005
95.712
-2.005
-2.05%
jan 1, 2006
96.379
+0.667
0.7%
jan 1, 2007
97.456
+1.077
1.12%
jan 1, 2008
98.167
+0.711
0.73%
jan 1, 2009
98.165
-0.003
0.0%
jan 1, 2010
98.447
+0.282
0.29%
jan 1, 2011
98.586
+0.14
0.14%
jan 1, 2012
98.779
+0.193
0.2%
jan 1, 2013
99.406
+0.627
0.64%
jan 1, 2014
99.285
-0.122
-0.12%
jan 1, 2015
99.799
+0.514
0.52%
Ranking of countries by current statistics by years


Comments: