29
/
en
AIzaSyAYiBZKx7MnpbEhh9jyipgxe19OcubqV5w
April 1, 2024
26839
Early-demographic dividend
EAR
false
2
1
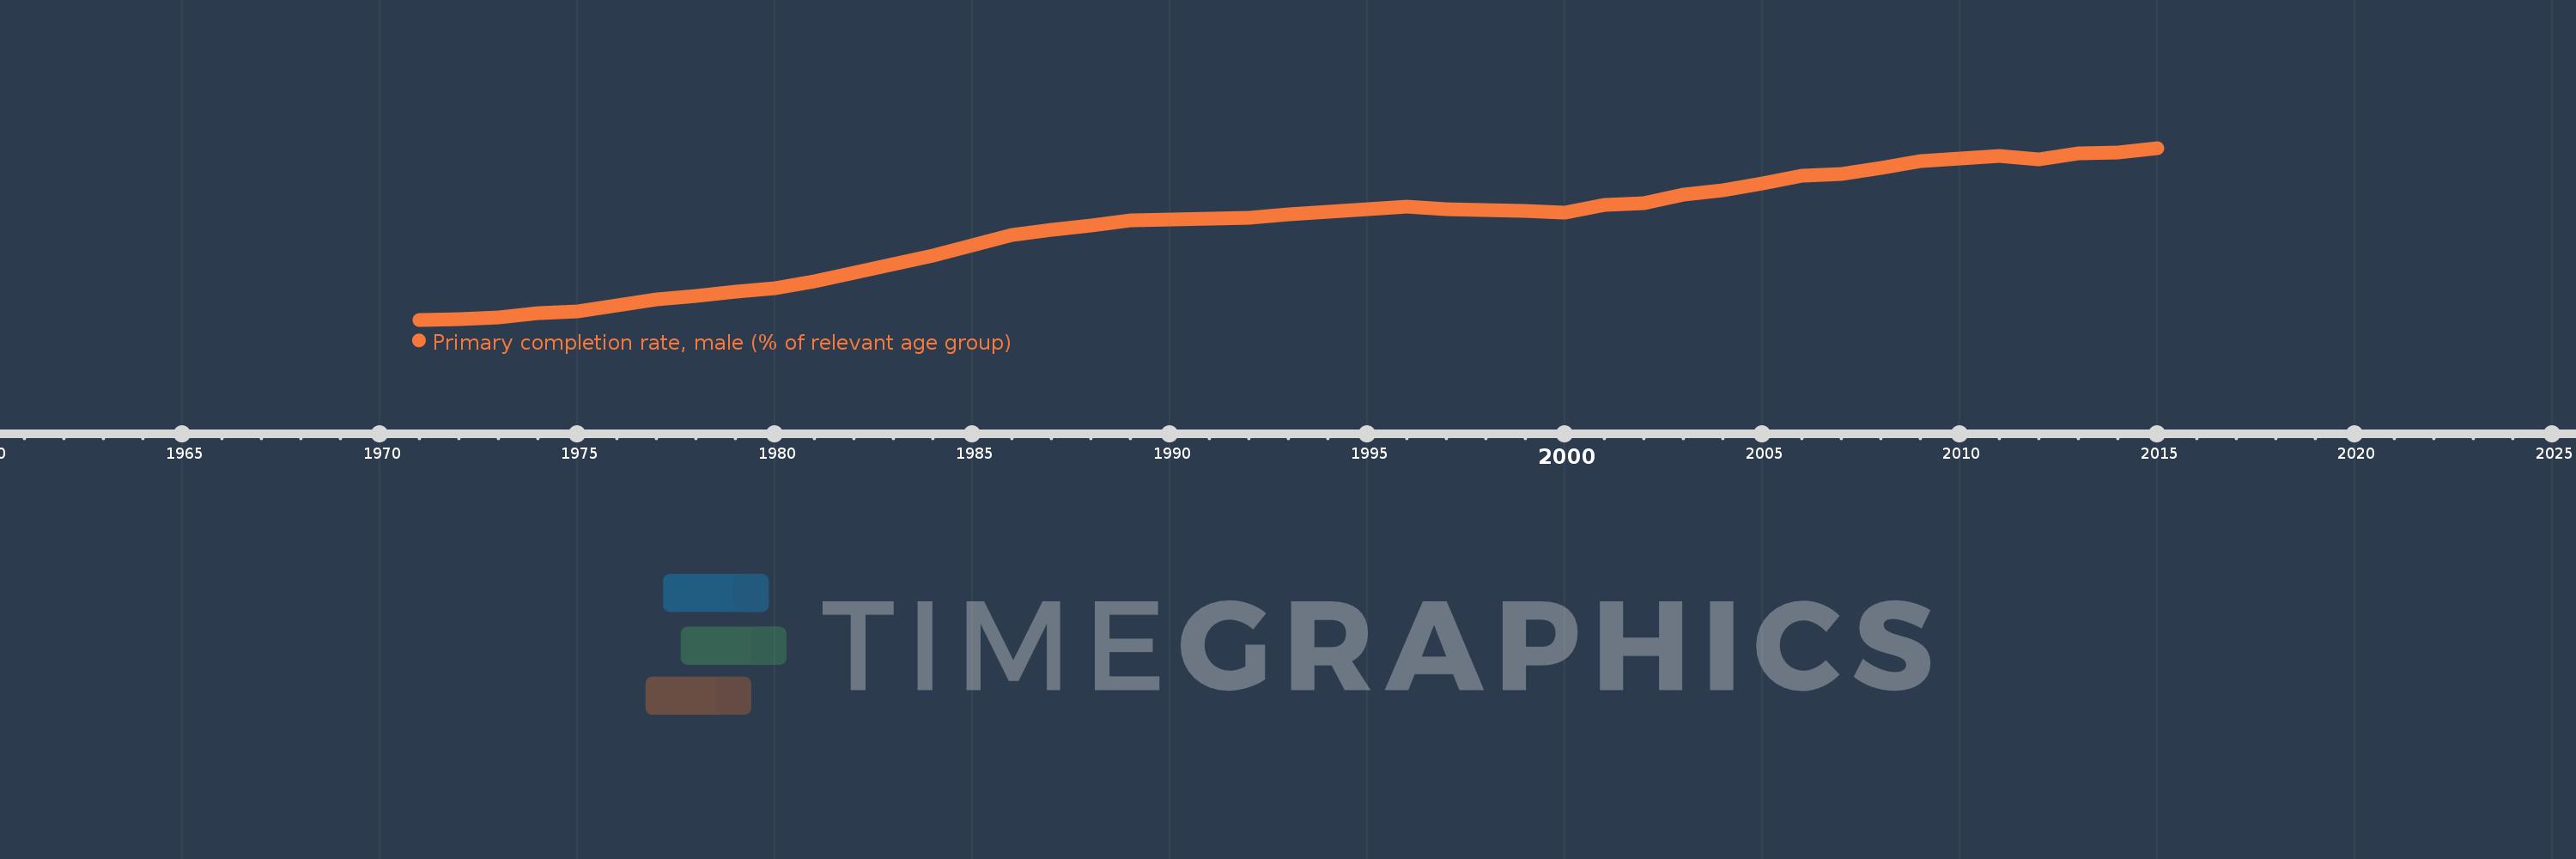
Primary completion rate, male (% of relevant age group)
2015,2014,2013,2012,2011,2010,2009,2008,2007,2006,2005,2004,2003,2002,2001,2000,1999,1998,1997,1996,1995,1994,1993,1992,1991,1990,1989,1988,1987,1986,1985,1984,1983,1982,1981,1980,1979,1978,1977,1976,1975,1974,1973,1972,1971
This statistics in other country:
AfghanistanAlbaniaAlgeriaAngolaAntigua and BarbudaArab WorldArgentinaArmeniaArubaAustriaAzerbaijanBahamas, TheBahrainBangladeshBarbadosBelarusBelgiumBelizeBeninBermudaBhutanBoliviaBosnia and HerzegovinaBotswanaBrunei DarussalamBulgariaBurkina FasoBurundiCabo VerdeCambodiaCameroonCanadaCaribbean small statesCentral African RepublicCentral Europe and the BalticsChadChileChinaColombiaComorosCongo, Dem. Rep.Congo, Rep.Costa RicaCote d'IvoireCroatiaCubaCyprusCzech RepublicDenmarkDjiboutiDominicaDominican RepublicEarly-demographic dividendEast Asia & PacificEast Asia & Pacific (excluding high income)East Asia & Pacific (IDA & IBRD countries)EcuadorEgypt, Arab Rep.El SalvadorEquatorial GuineaEritreaEstoniaEthiopiaEuro areaEurope & Central AsiaEurope & Central Asia (excluding high income)Europe & Central Asia (IDA & IBRD countries)European UnionFijiFinlandFragile and conflict affected situationsFranceGabonGambia, TheGeorgiaGermanyGhanaGreeceGrenadaGuatemalaGuineaGuinea-BissauGuyanaHaitiHeavily indebted poor countries (HIPC)High incomeHondurasHong Kong SAR, ChinaHungaryIBRD onlyIcelandIDA & IBRD totalIDA blendIDA onlyIDA totalIndiaIndonesiaIran, Islamic Rep.IraqIrelandIsraelItalyJamaicaJapanJordanKazakhstanKenyaKiribatiKorea, Dem. People’s Rep.Korea, Rep.KuwaitKyrgyz RepublicLao PDRLate-demographic dividendLatin America & Caribbean Latin America & Caribbean (excluding high income)Latin America & the Caribbean (IDA & IBRD countries)LatviaLeast developed countries: UN classificationLebanonLesothoLiberiaLibyaLiechtensteinLithuaniaLow & middle incomeLow incomeLower middle incomeLuxembourgMacao SAR, ChinaMacedonia, FYRMadagascarMalawiMaldivesMaliMaltaMarshall IslandsMauritaniaMauritiusMexicoMiddle East & North AfricaMiddle East & North Africa (excluding high income)Middle East & North Africa (IDA & IBRD countries)Middle incomeMoldovaMongoliaMontenegroMoroccoMozambiqueMyanmarNamibiaNauruNepalNetherlandsNew ZealandNicaraguaNigerNigeriaNorwayOECD membersOmanOther small statesPacific island small statesPakistanPalauPanamaPapua New GuineaParaguayPeruPhilippinesPolandPortugalPost-demographic dividendPre-demographic dividendQatarRomaniaRussian FederationRwandaSamoaSan MarinoSao Tome and PrincipeSaudi ArabiaSenegalSerbiaSeychellesSierra LeoneSlovak RepublicSloveniaSmall statesSolomon IslandsSouth AfricaSouth AsiaSouth Asia (IDA & IBRD)South SudanSpainSri LankaSt. Kitts and NevisSt. LuciaSt. Vincent and the GrenadinesSub-Saharan Africa Sub-Saharan Africa (excluding high income)Sub-Saharan Africa (IDA & IBRD countries)SudanSurinameSwazilandSwedenSwitzerlandSyrian Arab RepublicTajikistanTanzaniaThailandTimor-LesteTogoTongaTrinidad and TobagoTunisiaTurkeyTuvaluUgandaUkraineUnited Arab EmiratesUpper middle incomeUruguayUzbekistanVanuatuVenezuela, RBVietnamWest Bank and GazaWorldYemen, Rep.ZambiaZimbabwe Timeline:
This timeline shows a graph from 1971 to 2015 of Early-demographic dividend. No data until 1970. Number of actual observations by date: 45.
Source name:
World Development Indicators
Source organization:
United Nations Educational, Scientific, and Cultural Organization (UNESCO) Institute for Statistics.
Categories, topics:
Education, Gender
Last updated:
apr 23, 2017
Indicators value changes by year
Minimum:
57.772
jan 1, 1971
Maximum:
91.794
jan 1, 2015
At the date of observation
Value
Absolute change
Change from previous value
jan 1, 1971
57.772
+57.772
0.0%
jan 1, 1972
57.818
+0.046
0.08%
jan 1, 1973
58.199
+0.381
0.66%
jan 1, 1974
59.108
+0.909
1.56%
jan 1, 1975
59.466
+0.358
0.61%
jan 1, 1976
60.568
+1.103
1.85%
jan 1, 1977
61.728
+1.16
1.92%
jan 1, 1978
62.49
+0.761
1.23%
jan 1, 1979
63.403
+0.913
1.46%
jan 1, 1980
64.02
+0.617
0.97%
jan 1, 1981
65.417
+1.397
2.18%
jan 1, 1982
67.031
+1.613
2.47%
jan 1, 1983
68.713
+1.682
2.51%
jan 1, 1984
70.432
+1.719
2.5%
jan 1, 1985
72.572
+2.14
3.04%
jan 1, 1986
74.6
+2.028
2.79%
jan 1, 1987
75.6
+1.0
1.34%
jan 1, 1988
76.422
+0.822
1.09%
jan 1, 1989
77.445
+1.023
1.34%
jan 1, 1990
77.603
+0.158
0.2%
jan 1, 1991
77.766
+0.163
0.21%
jan 1, 1992
77.973
+0.207
0.27%
jan 1, 1993
78.632
+0.659
0.85%
jan 1, 1994
79.237
+0.606
0.77%
jan 1, 1995
79.698
+0.46
0.58%
jan 1, 1996
80.1
+0.402
0.5%
jan 1, 1997
79.634
-0.466
-0.58%
jan 1, 1998
79.414
-0.22
-0.28%
jan 1, 1999
79.272
-0.142
-0.18%
jan 1, 2000
79.025
-0.247
-0.31%
jan 1, 2001
80.464
+1.439
1.82%
jan 1, 2002
80.776
+0.312
0.39%
jan 1, 2003
82.567
+1.791
2.22%
jan 1, 2004
83.381
+0.814
0.99%
jan 1, 2005
84.818
+1.437
1.72%
jan 1, 2006
86.31
+1.492
1.76%
jan 1, 2007
86.586
+0.276
0.32%
jan 1, 2008
87.914
+1.328
1.53%
jan 1, 2009
89.183
+1.269
1.44%
jan 1, 2010
89.679
+0.496
0.56%
jan 1, 2011
90.134
+0.455
0.51%
jan 1, 2012
89.593
-0.541
-0.6%
jan 1, 2013
90.766
+1.173
1.31%
jan 1, 2014
90.946
+0.179
0.2%
jan 1, 2015
91.794
+0.848
0.93%
Ranking of countries by current statistics by years


Comments: