29
/
en
AIzaSyAYiBZKx7MnpbEhh9jyipgxe19OcubqV5w
April 1, 2024
107896
Colombia
COL
true
2
1
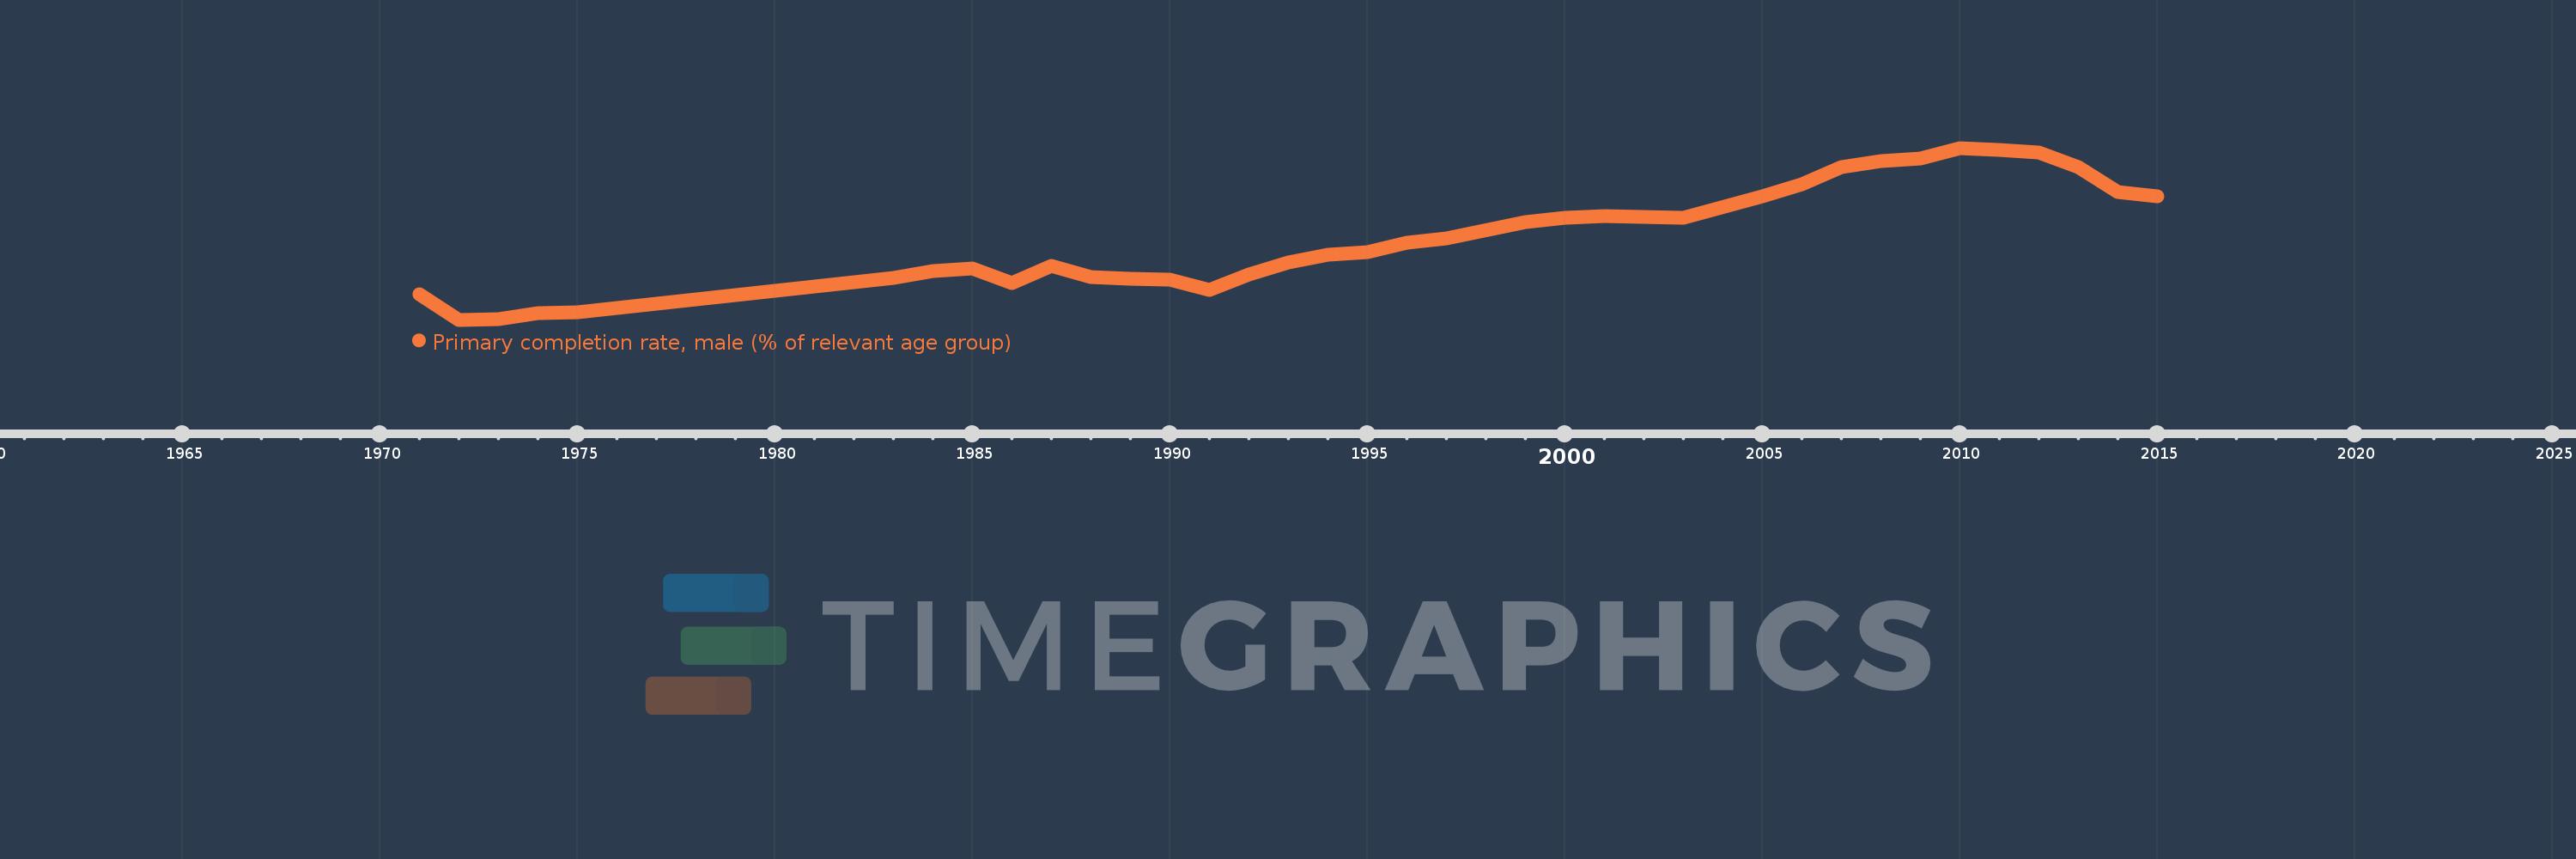
Primary completion rate, male (% of relevant age group)
2015,2014,2013,2012,2011,2010,2009,2008,2007,2006,2005,2003,2001,2000,1999,1997,1996,1995,1994,1993,1992,1991,1990,1989,1988,1987,1986,1985,1984,1983,1975,1974,1973,1972,1971
This statistics in other country:
AfghanistanAlbaniaAlgeriaAngolaAntigua and BarbudaArab WorldArgentinaArmeniaArubaAustriaAzerbaijanBahamas, TheBahrainBangladeshBarbadosBelarusBelgiumBelizeBeninBermudaBhutanBoliviaBosnia and HerzegovinaBotswanaBrunei DarussalamBulgariaBurkina FasoBurundiCabo VerdeCambodiaCameroonCanadaCaribbean small statesCentral African RepublicCentral Europe and the BalticsChadChileChinaColombiaComorosCongo, Dem. Rep.Congo, Rep.Costa RicaCote d'IvoireCroatiaCubaCyprusCzech RepublicDenmarkDjiboutiDominicaDominican RepublicEarly-demographic dividendEast Asia & PacificEast Asia & Pacific (excluding high income)East Asia & Pacific (IDA & IBRD countries)EcuadorEgypt, Arab Rep.El SalvadorEquatorial GuineaEritreaEstoniaEthiopiaEuro areaEurope & Central AsiaEurope & Central Asia (excluding high income)Europe & Central Asia (IDA & IBRD countries)European UnionFijiFinlandFragile and conflict affected situationsFranceGabonGambia, TheGeorgiaGermanyGhanaGreeceGrenadaGuatemalaGuineaGuinea-BissauGuyanaHaitiHeavily indebted poor countries (HIPC)High incomeHondurasHong Kong SAR, ChinaHungaryIBRD onlyIcelandIDA & IBRD totalIDA blendIDA onlyIDA totalIndiaIndonesiaIran, Islamic Rep.IraqIrelandIsraelItalyJamaicaJapanJordanKazakhstanKenyaKiribatiKorea, Dem. People’s Rep.Korea, Rep.KuwaitKyrgyz RepublicLao PDRLate-demographic dividendLatin America & Caribbean Latin America & Caribbean (excluding high income)Latin America & the Caribbean (IDA & IBRD countries)LatviaLeast developed countries: UN classificationLebanonLesothoLiberiaLibyaLiechtensteinLithuaniaLow & middle incomeLow incomeLower middle incomeLuxembourgMacao SAR, ChinaMacedonia, FYRMadagascarMalawiMaldivesMaliMaltaMarshall IslandsMauritaniaMauritiusMexicoMiddle East & North AfricaMiddle East & North Africa (excluding high income)Middle East & North Africa (IDA & IBRD countries)Middle incomeMoldovaMongoliaMontenegroMoroccoMozambiqueMyanmarNamibiaNauruNepalNetherlandsNew ZealandNicaraguaNigerNigeriaNorwayOECD membersOmanOther small statesPacific island small statesPakistanPalauPanamaPapua New GuineaParaguayPeruPhilippinesPolandPortugalPost-demographic dividendPre-demographic dividendQatarRomaniaRussian FederationRwandaSamoaSan MarinoSao Tome and PrincipeSaudi ArabiaSenegalSerbiaSeychellesSierra LeoneSlovak RepublicSloveniaSmall statesSolomon IslandsSouth AfricaSouth AsiaSouth Asia (IDA & IBRD)South SudanSpainSri LankaSt. Kitts and NevisSt. LuciaSt. Vincent and the GrenadinesSub-Saharan Africa Sub-Saharan Africa (excluding high income)Sub-Saharan Africa (IDA & IBRD countries)SudanSurinameSwazilandSwedenSwitzerlandSyrian Arab RepublicTajikistanTanzaniaThailandTimor-LesteTogoTongaTrinidad and TobagoTunisiaTurkeyTuvaluUgandaUkraineUnited Arab EmiratesUpper middle incomeUruguayUzbekistanVanuatuVenezuela, RBVietnamWest Bank and GazaWorldYemen, Rep.ZambiaZimbabwe Timeline:
This timeline shows a graph from 1971 to 2015 of Colombia. No data until 1970. Number of actual observations by date: 35.
Source name:
World Development Indicators
Source organization:
United Nations Educational, Scientific, and Cultural Organization (UNESCO) Institute for Statistics.
Categories, topics:
Education, Gender
Last updated:
apr 23, 2017
Indicators value changes by year
Minimum:
47.976
jan 1, 1972
Maximum:
122.034
jan 1, 2010
At the date of observation
Value
Absolute change
Change from previous value
jan 1, 1971
58.861
+58.861
0.0%
jan 1, 1972
47.976
-10.884
-18.49%
jan 1, 1973
48.247
+0.271
0.56%
jan 1, 1974
50.922
+2.676
5.55%
jan 1, 1975
51.051
+0.129
0.25%
jan 1, 1983
65.985
+14.934
29.25%
jan 1, 1984
68.899
+2.914
4.42%
jan 1, 1985
69.908
+1.009
1.46%
jan 1, 1986
63.967
-5.941
-8.5%
jan 1, 1987
71.193
+7.226
11.3%
jan 1, 1988
66.486
-4.707
-6.61%
jan 1, 1989
65.672
-0.813
-1.22%
jan 1, 1990
65.091
-0.581
-0.89%
jan 1, 1991
60.746
-4.345
-6.68%
jan 1, 1992
67.481
+6.735
11.09%
jan 1, 1993
72.587
+5.106
7.57%
jan 1, 1994
75.934
+3.347
4.61%
jan 1, 1995
76.995
+1.061
1.4%
jan 1, 1996
81.083
+4.089
5.31%
jan 1, 1997
83.058
+1.974
2.43%
jan 1, 1999
89.972
+6.915
8.33%
jan 1, 2000
91.912
+1.939
2.16%
jan 1, 2001
92.58
+0.668
0.73%
jan 1, 2003
91.817
-0.762
-0.82%
jan 1, 2005
101.367
+9.55
10.4%
jan 1, 2006
106.384
+5.017
4.95%
jan 1, 2007
113.707
+7.323
6.88%
jan 1, 2008
116.202
+2.495
2.19%
jan 1, 2009
117.413
+1.211
1.04%
jan 1, 2010
122.034
+4.621
3.94%
jan 1, 2011
121.01
-1.024
-0.84%
jan 1, 2012
120.08
-0.931
-0.77%
jan 1, 2013
113.81
-6.269
-5.22%
jan 1, 2014
102.887
-10.923
-9.6%
jan 1, 2015
101.304
-1.583
-1.54%
Ranking of countries by current statistics by years


Comments: