29
/
en
AIzaSyAYiBZKx7MnpbEhh9jyipgxe19OcubqV5w
April 1, 2024
50392
Middle East & North Africa (IDA & IBRD countries)
TMN
false
2
1
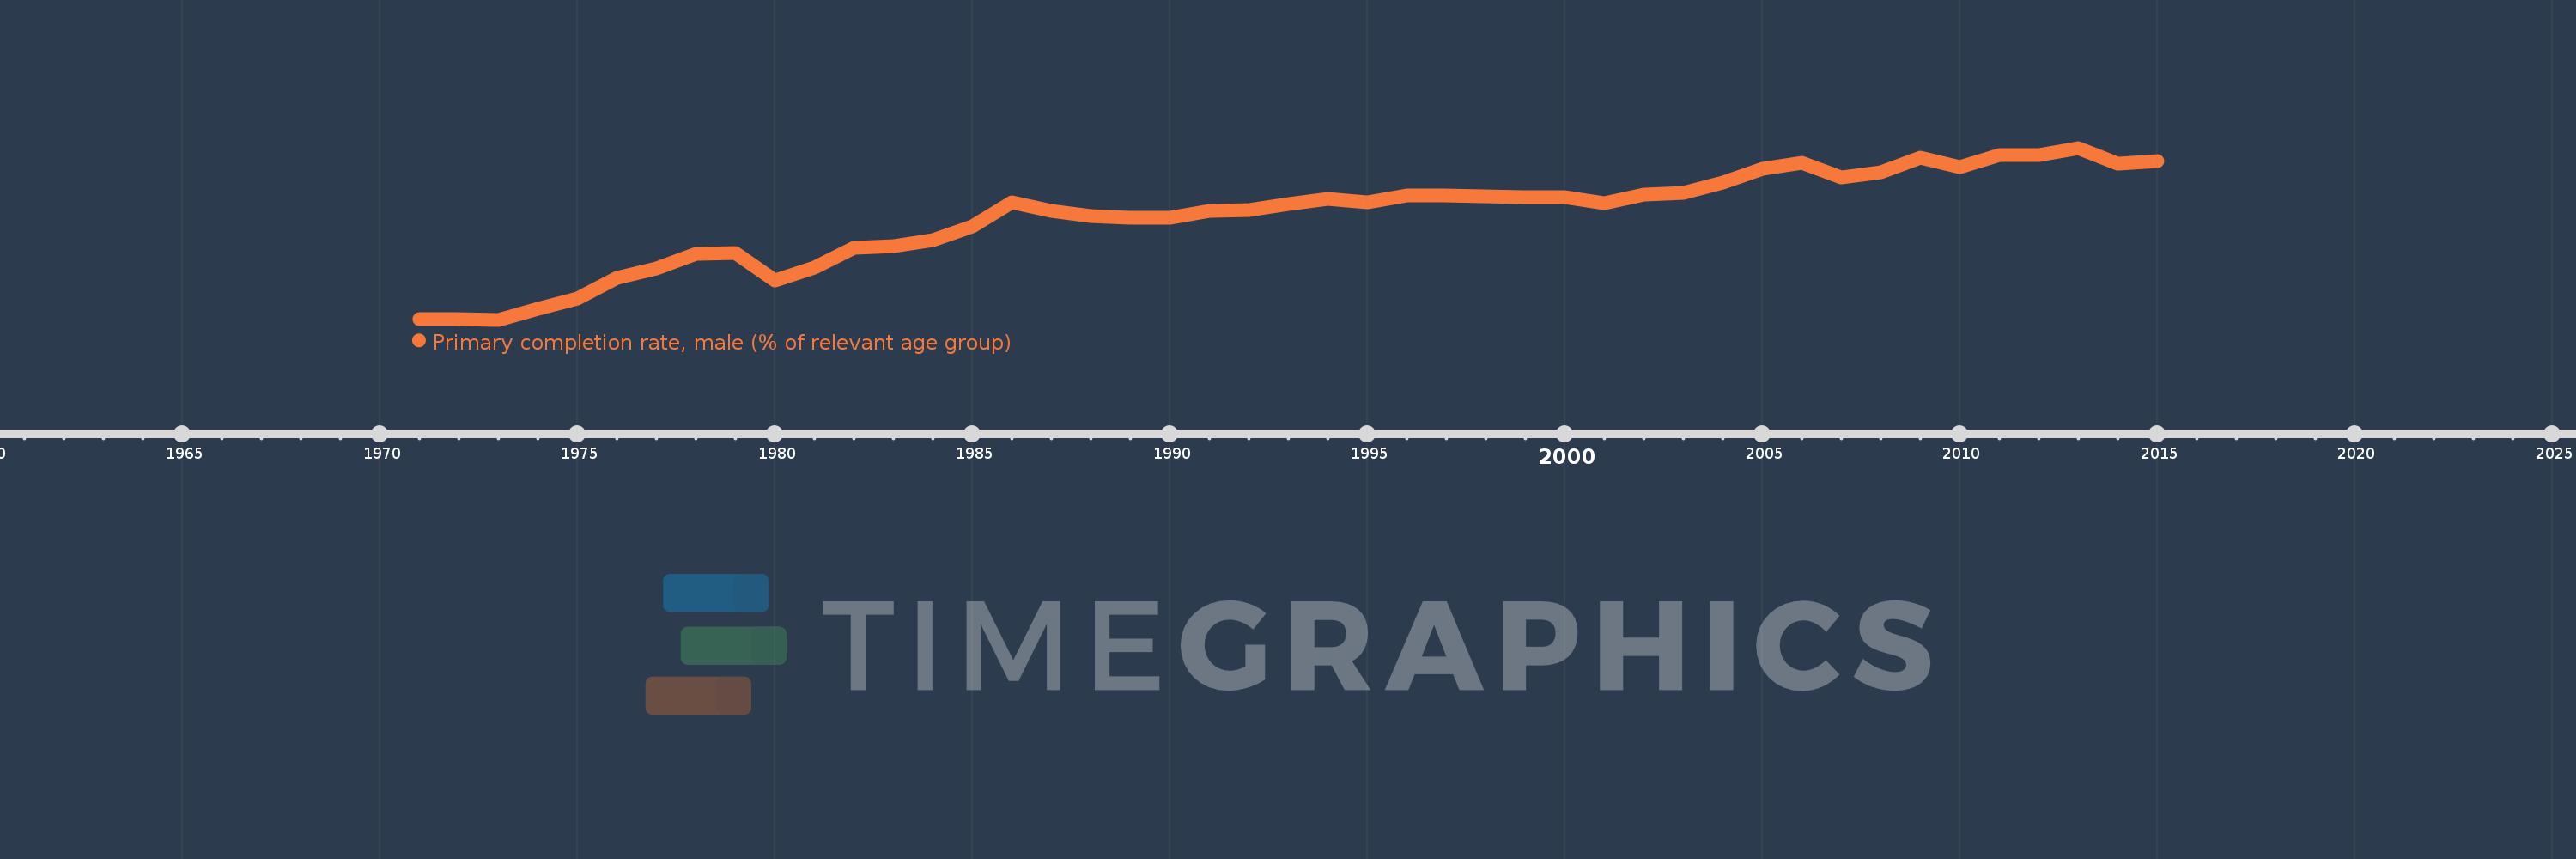
Primary completion rate, male (% of relevant age group)
2015,2014,2013,2012,2011,2010,2009,2008,2007,2006,2005,2004,2003,2002,2001,2000,1999,1998,1997,1996,1995,1994,1993,1992,1991,1990,1989,1988,1987,1986,1985,1984,1983,1982,1981,1980,1979,1978,1977,1976,1975,1974,1973,1972,1971
This statistics in other country:
AfghanistanAlbaniaAlgeriaAngolaAntigua and BarbudaArab WorldArgentinaArmeniaArubaAustriaAzerbaijanBahamas, TheBahrainBangladeshBarbadosBelarusBelgiumBelizeBeninBermudaBhutanBoliviaBosnia and HerzegovinaBotswanaBrunei DarussalamBulgariaBurkina FasoBurundiCabo VerdeCambodiaCameroonCanadaCaribbean small statesCentral African RepublicCentral Europe and the BalticsChadChileChinaColombiaComorosCongo, Dem. Rep.Congo, Rep.Costa RicaCote d'IvoireCroatiaCubaCyprusCzech RepublicDenmarkDjiboutiDominicaDominican RepublicEarly-demographic dividendEast Asia & PacificEast Asia & Pacific (excluding high income)East Asia & Pacific (IDA & IBRD countries)EcuadorEgypt, Arab Rep.El SalvadorEquatorial GuineaEritreaEstoniaEthiopiaEuro areaEurope & Central AsiaEurope & Central Asia (excluding high income)Europe & Central Asia (IDA & IBRD countries)European UnionFijiFinlandFragile and conflict affected situationsFranceGabonGambia, TheGeorgiaGermanyGhanaGreeceGrenadaGuatemalaGuineaGuinea-BissauGuyanaHaitiHeavily indebted poor countries (HIPC)High incomeHondurasHong Kong SAR, ChinaHungaryIBRD onlyIcelandIDA & IBRD totalIDA blendIDA onlyIDA totalIndiaIndonesiaIran, Islamic Rep.IraqIrelandIsraelItalyJamaicaJapanJordanKazakhstanKenyaKiribatiKorea, Dem. People’s Rep.Korea, Rep.KuwaitKyrgyz RepublicLao PDRLate-demographic dividendLatin America & Caribbean Latin America & Caribbean (excluding high income)Latin America & the Caribbean (IDA & IBRD countries)LatviaLeast developed countries: UN classificationLebanonLesothoLiberiaLibyaLiechtensteinLithuaniaLow & middle incomeLow incomeLower middle incomeLuxembourgMacao SAR, ChinaMacedonia, FYRMadagascarMalawiMaldivesMaliMaltaMarshall IslandsMauritaniaMauritiusMexicoMiddle East & North AfricaMiddle East & North Africa (excluding high income)Middle East & North Africa (IDA & IBRD countries)Middle incomeMoldovaMongoliaMontenegroMoroccoMozambiqueMyanmarNamibiaNauruNepalNetherlandsNew ZealandNicaraguaNigerNigeriaNorwayOECD membersOmanOther small statesPacific island small statesPakistanPalauPanamaPapua New GuineaParaguayPeruPhilippinesPolandPortugalPost-demographic dividendPre-demographic dividendQatarRomaniaRussian FederationRwandaSamoaSan MarinoSao Tome and PrincipeSaudi ArabiaSenegalSerbiaSeychellesSierra LeoneSlovak RepublicSloveniaSmall statesSolomon IslandsSouth AfricaSouth AsiaSouth Asia (IDA & IBRD)South SudanSpainSri LankaSt. Kitts and NevisSt. LuciaSt. Vincent and the GrenadinesSub-Saharan Africa Sub-Saharan Africa (excluding high income)Sub-Saharan Africa (IDA & IBRD countries)SudanSurinameSwazilandSwedenSwitzerlandSyrian Arab RepublicTajikistanTanzaniaThailandTimor-LesteTogoTongaTrinidad and TobagoTunisiaTurkeyTuvaluUgandaUkraineUnited Arab EmiratesUpper middle incomeUruguayUzbekistanVanuatuVenezuela, RBVietnamWest Bank and GazaWorldYemen, Rep.ZambiaZimbabwe Timeline:
This timeline shows a graph from 1971 to 2015 of Middle East & North Africa (IDA & IBRD countries). No data until 1970. Number of actual observations by date: 45.
Source name:
World Development Indicators
Source organization:
United Nations Educational, Scientific, and Cultural Organization (UNESCO) Institute for Statistics.
Categories, topics:
Education, Gender
Last updated:
apr 23, 2017
Indicators value changes by year
Minimum:
61.606
jan 1, 1973
Maximum:
96.568
jan 1, 2013
At the date of observation
Value
Absolute change
Change from previous value
jan 1, 1971
61.7
+61.7
0.0%
jan 1, 1972
61.655
-0.045
-0.07%
jan 1, 1973
61.606
-0.049
-0.08%
jan 1, 1974
63.855
+2.25
3.65%
jan 1, 1975
65.923
+2.067
3.24%
jan 1, 1976
70.067
+4.145
6.29%
jan 1, 1977
71.973
+1.905
2.72%
jan 1, 1978
75.03
+3.057
4.25%
jan 1, 1979
75.197
+0.167
0.22%
jan 1, 1980
69.65
-5.547
-7.38%
jan 1, 1981
72.245
+2.595
3.73%
jan 1, 1982
76.221
+3.976
5.5%
jan 1, 1983
76.606
+0.385
0.5%
jan 1, 1984
77.821
+1.215
1.59%
jan 1, 1985
80.56
+2.739
3.52%
jan 1, 1986
85.572
+5.012
6.22%
jan 1, 1987
83.718
-1.854
-2.17%
jan 1, 1988
82.746
-0.972
-1.16%
jan 1, 1989
82.405
-0.341
-0.41%
jan 1, 1990
82.283
-0.121
-0.15%
jan 1, 1991
83.727
+1.444
1.75%
jan 1, 1992
83.996
+0.269
0.32%
jan 1, 1993
85.128
+1.132
1.35%
jan 1, 1994
86.122
+0.994
1.17%
jan 1, 1995
85.52
-0.602
-0.7%
jan 1, 1996
86.889
+1.369
1.6%
jan 1, 1997
86.815
-0.073
-0.08%
jan 1, 1998
86.667
-0.148
-0.17%
jan 1, 1999
86.627
-0.04
-0.05%
jan 1, 2000
86.484
-0.143
-0.16%
jan 1, 2001
85.268
-1.217
-1.41%
jan 1, 2002
87.117
+1.85
2.17%
jan 1, 2003
87.482
+0.365
0.42%
jan 1, 2004
89.494
+2.012
2.3%
jan 1, 2005
92.376
+2.882
3.22%
jan 1, 2006
93.505
+1.129
1.22%
jan 1, 2007
90.526
-2.979
-3.19%
jan 1, 2008
91.568
+1.042
1.15%
jan 1, 2009
94.626
+3.058
3.34%
jan 1, 2010
92.749
-1.876
-1.98%
jan 1, 2011
95.051
+2.301
2.48%
jan 1, 2012
95.068
+0.017
0.02%
jan 1, 2013
96.568
+1.5
1.58%
jan 1, 2014
93.345
-3.223
-3.34%
jan 1, 2015
93.841
+0.496
0.53%
Ranking of countries by current statistics by years


Comments: