29
/
en
AIzaSyAYiBZKx7MnpbEhh9jyipgxe19OcubqV5w
April 1, 2024
24456
Arab World
ARB
false
2
1
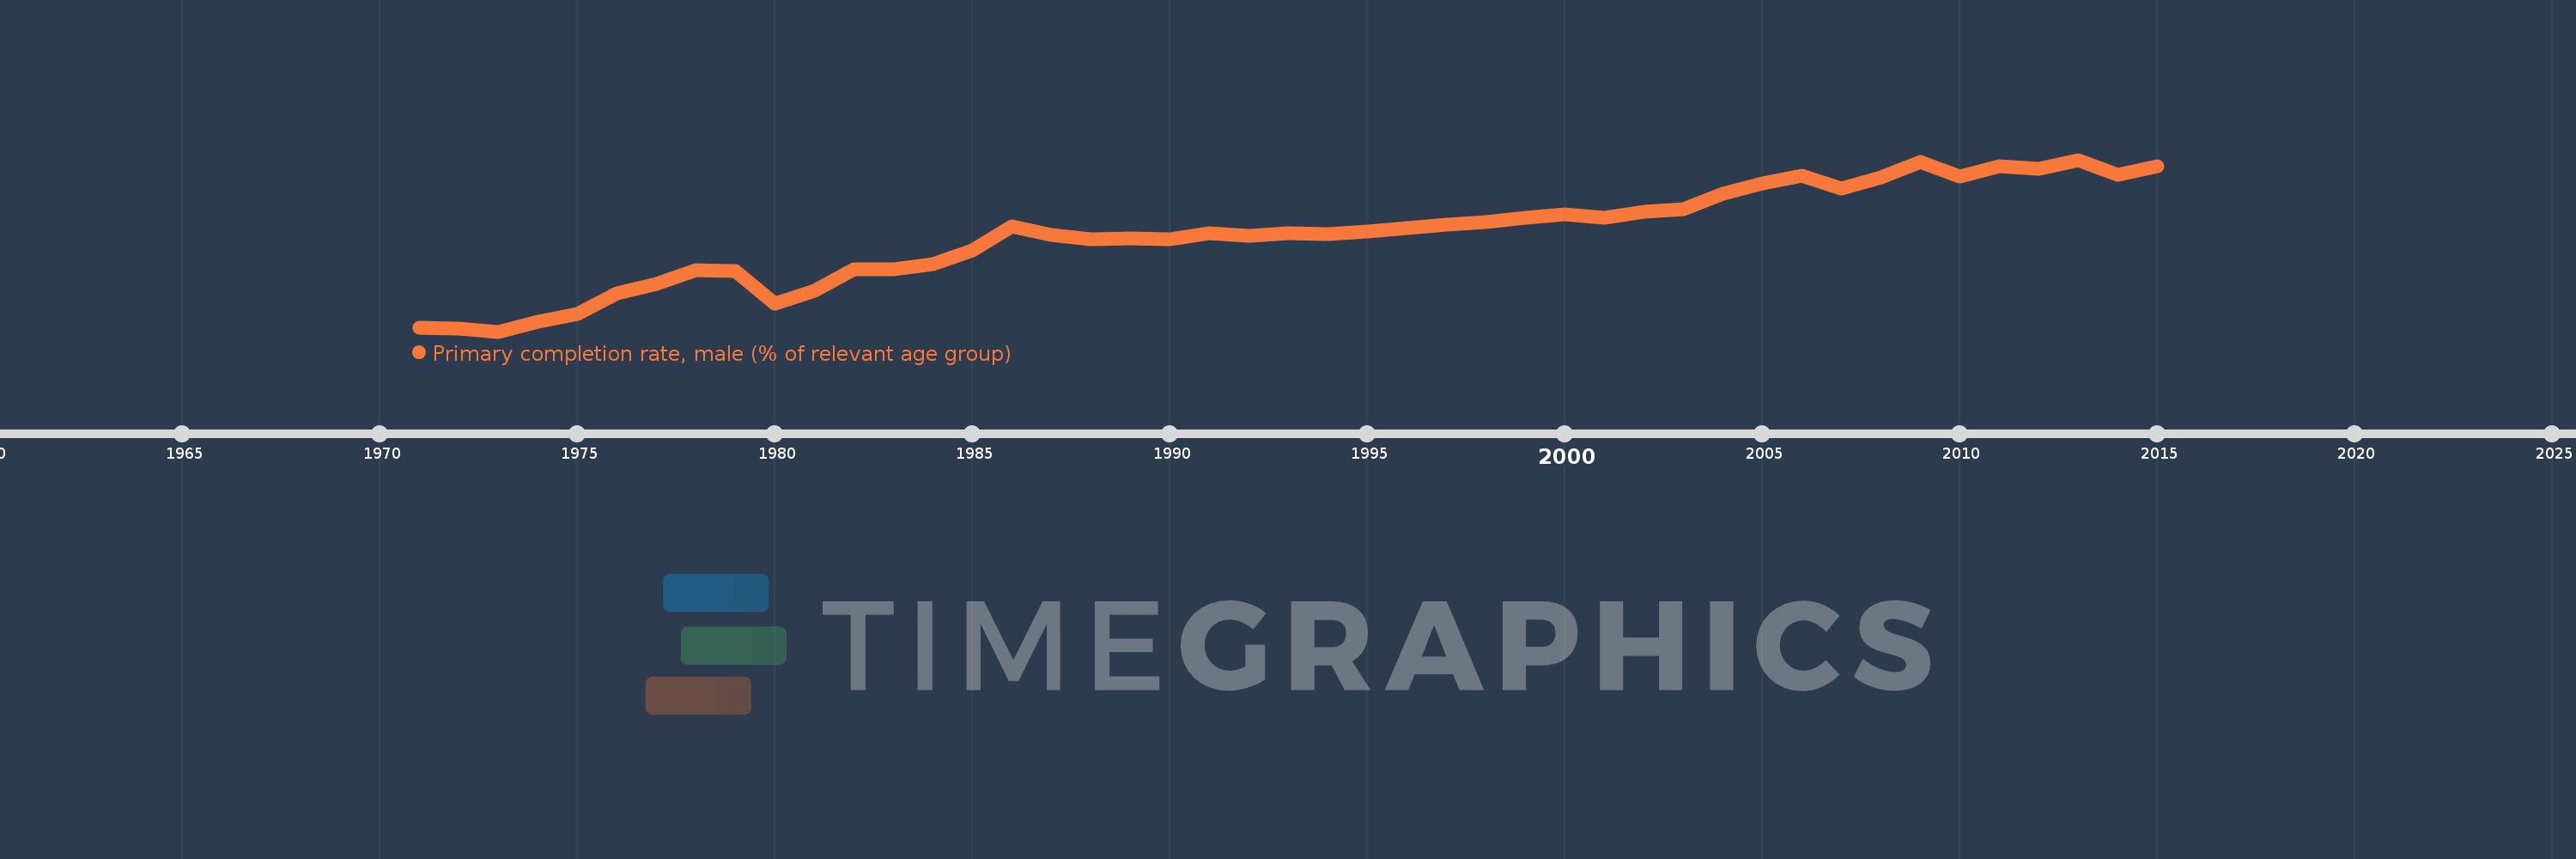
Primary completion rate, male (% of relevant age group)
2015,2014,2013,2012,2011,2010,2009,2008,2007,2006,2005,2004,2003,2002,2001,2000,1999,1998,1997,1996,1995,1994,1993,1992,1991,1990,1989,1988,1987,1986,1985,1984,1983,1982,1981,1980,1979,1978,1977,1976,1975,1974,1973,1972,1971
This statistics in other country:
AfghanistanAlbaniaAlgeriaAngolaAntigua and BarbudaArab WorldArgentinaArmeniaArubaAustriaAzerbaijanBahamas, TheBahrainBangladeshBarbadosBelarusBelgiumBelizeBeninBermudaBhutanBoliviaBosnia and HerzegovinaBotswanaBrunei DarussalamBulgariaBurkina FasoBurundiCabo VerdeCambodiaCameroonCanadaCaribbean small statesCentral African RepublicCentral Europe and the BalticsChadChileChinaColombiaComorosCongo, Dem. Rep.Congo, Rep.Costa RicaCote d'IvoireCroatiaCubaCyprusCzech RepublicDenmarkDjiboutiDominicaDominican RepublicEarly-demographic dividendEast Asia & PacificEast Asia & Pacific (excluding high income)East Asia & Pacific (IDA & IBRD countries)EcuadorEgypt, Arab Rep.El SalvadorEquatorial GuineaEritreaEstoniaEthiopiaEuro areaEurope & Central AsiaEurope & Central Asia (excluding high income)Europe & Central Asia (IDA & IBRD countries)European UnionFijiFinlandFragile and conflict affected situationsFranceGabonGambia, TheGeorgiaGermanyGhanaGreeceGrenadaGuatemalaGuineaGuinea-BissauGuyanaHaitiHeavily indebted poor countries (HIPC)High incomeHondurasHong Kong SAR, ChinaHungaryIBRD onlyIcelandIDA & IBRD totalIDA blendIDA onlyIDA totalIndiaIndonesiaIran, Islamic Rep.IraqIrelandIsraelItalyJamaicaJapanJordanKazakhstanKenyaKiribatiKorea, Dem. People’s Rep.Korea, Rep.KuwaitKyrgyz RepublicLao PDRLate-demographic dividendLatin America & Caribbean Latin America & Caribbean (excluding high income)Latin America & the Caribbean (IDA & IBRD countries)LatviaLeast developed countries: UN classificationLebanonLesothoLiberiaLibyaLiechtensteinLithuaniaLow & middle incomeLow incomeLower middle incomeLuxembourgMacao SAR, ChinaMacedonia, FYRMadagascarMalawiMaldivesMaliMaltaMarshall IslandsMauritaniaMauritiusMexicoMiddle East & North AfricaMiddle East & North Africa (excluding high income)Middle East & North Africa (IDA & IBRD countries)Middle incomeMoldovaMongoliaMontenegroMoroccoMozambiqueMyanmarNamibiaNauruNepalNetherlandsNew ZealandNicaraguaNigerNigeriaNorwayOECD membersOmanOther small statesPacific island small statesPakistanPalauPanamaPapua New GuineaParaguayPeruPhilippinesPolandPortugalPost-demographic dividendPre-demographic dividendQatarRomaniaRussian FederationRwandaSamoaSan MarinoSao Tome and PrincipeSaudi ArabiaSenegalSerbiaSeychellesSierra LeoneSlovak RepublicSloveniaSmall statesSolomon IslandsSouth AfricaSouth AsiaSouth Asia (IDA & IBRD)South SudanSpainSri LankaSt. Kitts and NevisSt. LuciaSt. Vincent and the GrenadinesSub-Saharan Africa Sub-Saharan Africa (excluding high income)Sub-Saharan Africa (IDA & IBRD countries)SudanSurinameSwazilandSwedenSwitzerlandSyrian Arab RepublicTajikistanTanzaniaThailandTimor-LesteTogoTongaTrinidad and TobagoTunisiaTurkeyTuvaluUgandaUkraineUnited Arab EmiratesUpper middle incomeUruguayUzbekistanVanuatuVenezuela, RBVietnamWest Bank and GazaWorldYemen, Rep.ZambiaZimbabwe Timeline:
This timeline shows a graph from 1971 to 2015 of Arab World. No data until 1970. Number of actual observations by date: 45.
Source name:
World Development Indicators
Source organization:
United Nations Educational, Scientific, and Cultural Organization (UNESCO) Institute for Statistics.
Categories, topics:
Education, Gender
Last updated:
apr 23, 2017
Indicators value changes by year
Minimum:
60.234
jan 1, 1973
At the date of observation
Value
Absolute change
Change from previous value
jan 1, 1971
60.871
+60.871
0.0%
jan 1, 1972
60.8
-0.07
-0.12%
jan 1, 1973
60.234
-0.566
-0.93%
jan 1, 1974
61.874
+1.64
2.72%
jan 1, 1975
63.326
+1.452
2.35%
jan 1, 1976
66.888
+3.562
5.63%
jan 1, 1977
68.441
+1.552
2.32%
jan 1, 1978
70.876
+2.436
3.56%
jan 1, 1979
70.703
-0.174
-0.25%
jan 1, 1980
65.128
-5.575
-7.88%
jan 1, 1981
67.324
+2.197
3.37%
jan 1, 1982
70.989
+3.665
5.44%
jan 1, 1983
71.095
+0.106
0.15%
jan 1, 1984
71.917
+0.822
1.16%
jan 1, 1985
74.227
+2.309
3.21%
jan 1, 1986
78.539
+4.313
5.81%
jan 1, 1987
76.973
-1.566
-1.99%
jan 1, 1988
76.265
-0.708
-0.92%
jan 1, 1989
76.318
+0.052
0.07%
jan 1, 1990
76.22
-0.098
-0.13%
jan 1, 1991
77.275
+1.055
1.38%
jan 1, 1992
76.766
-0.509
-0.66%
jan 1, 1993
77.241
+0.475
0.62%
jan 1, 1994
77.122
-0.12
-0.15%
jan 1, 1995
77.607
+0.485
0.63%
jan 1, 1996
78.214
+0.607
0.78%
jan 1, 1997
78.836
+0.622
0.8%
jan 1, 1998
79.272
+0.436
0.55%
jan 1, 1999
79.977
+0.705
0.89%
jan 1, 2000
80.556
+0.58
0.72%
jan 1, 2001
79.921
-0.636
-0.79%
jan 1, 2002
81.008
+1.087
1.36%
jan 1, 2003
81.487
+0.479
0.59%
jan 1, 2004
84.113
+2.625
3.22%
jan 1, 2005
85.978
+1.865
2.22%
jan 1, 2006
87.196
+1.218
1.42%
jan 1, 2007
84.967
-2.228
-2.56%
jan 1, 2008
86.968
+2.001
2.35%
jan 1, 2009
89.556
+2.588
2.98%
jan 1, 2010
87.17
-2.386
-2.66%
jan 1, 2011
88.859
+1.689
1.94%
jan 1, 2012
88.445
-0.414
-0.47%
jan 1, 2013
90.0
+1.555
1.76%
jan 1, 2014
87.465
-2.535
-2.82%
jan 1, 2015
88.811
+1.346
1.54%
Ranking of countries by current statistics by years


Comments: